You’ll drive faster, measurable service performance by streaming DMS-backed leaderboards to shop TVs and mobile devices every 15 minutes, so technicians and advisors see live KPIs, rankings, and goals they can act on. That real‑time visibility cuts cycle time, boosts RO capture and labor efficiency, and creates accountable competition that lifts productivity and sales-per-RO. Use the data to set incentives, spot bottlenecks, and coach skills. Continue below to see the specific metrics and steps to implement.
Key Takeaways
- Deliver live KPI visibility (ROs, labor efficiency, CSI) every 15 minutes to drive immediate corrective actions.
- Standardize data across TVs and mobile devices so technicians and managers focus on shared performance targets.
- Fuel accountable competition with transparent individual and team rankings to boost productivity and RO capture.
- Enable advisors to track sales-per-RO and customer-pay ROs in real time, improving retention and upsell opportunities.
- Convert live metrics into measurable goals and incentives, identifying bottlenecks and measuring ROI across six key KPIs.
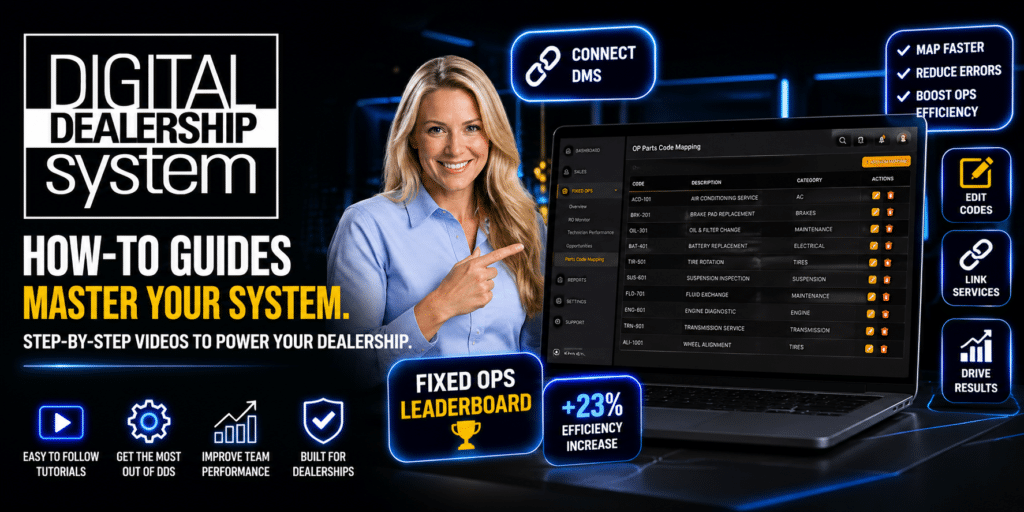
What Fixed‑Ops Leaderboards Are (And 3 Dealer Benefits)
Think of Fixed‑Ops Leaderboards as your service department’s real‑time dashboard: they track KPIs like Repair Orders, labor efficiency, and customer satisfaction and refresh automatically—often every 15 minutes via DMS‑connected reports—so you can spot trends and act fast. You’ll get precise performance metrics displayed on mobile and desktop, cutting admin time and surfacing gaps immediately. That data transparency means managers and techs see the same numbers, so corrective actions are rapid and evidence‑based. Visible targets drive team accountability: advisors and technicians monitor ROs, productivity, and CSI, then adjust behavior to meet goals. Finally, a competition culture emerges naturally—friendly rivalry raises throughput and profitability while improving retention and service quality across the department.
Connect DMS, TVs & Mobile for Real‑Time Visibility
Connect your DMS to TVs and mobile devices so everyone in service is working off the same real‑time data—refreshed every 15 minutes—to spot trends, close Revenue Opportunities, and boost productivity immediately. You’ll use digital integration to push live performance analytics to shop-floor TVs and individual phones, ensuring advisors and techs see ROs, hours, and efficiency simultaneously. Customized screens highlight team and individual benchmarks so managers can coach instantly and correct course. Mobile access keeps data at technicians’ fingertips for faster decisions and fewer handoffs. The result: measurable reductions in cycle time, higher RO capture rates, and clearer accountability. Implement tight DMS-to-display syncing, standardize dashboards, and monitor uptake to sustain continuous, data-driven improvements.
Boost Technician Productivity With Live KPI Tracking
With DMS-fed leaderboards now streaming to shop TVs and phones every 15 minutes, you can push that same live data directly to technicians so they see Tech Efficiency, Effective Labor Rate, and RO counts in real time. You’ll give technicians immediate visibility into core performance metrics, so gaps are obvious and corrected fast. Live KPI tracking turns daily goals into minute-by-minute actions: technicians adjust pace, prioritize jobs, and close ROs with higher consistency. Friendly, transparent rankings create accountable competition that lifts average output and revenue per RO. Use customized reports tied to individual targets to coach skill growth and measure improvement. The result is measurable gains in tech efficiency, productivity, and service-department profitability without guesswork.
Increase Advisor Sales & Customer Retention With Leaderboards
Use real-time leaderboards to motivate advisors by making sales-per-RO and CSI visible so they can chase concrete, measurable targets. Track improvements like a $15 lift in sales per RO — which can mean about $1,500 more monthly — and tie those gains to retention-focused communication practices. Then coach advisors on precise behaviors (timely follow-ups, personalized service explanations) that convert leaderboard momentum into repeat customers.
Advisor Sales Motivation
Anyone on your service team can see precisely how their day-to-day actions move the needle when real-time leaderboards display sales-per-RO and CSI side-by-side, creating instant, data-driven competition that boosts motivation and performance. You’ll use clear sales performance metrics to benchmark against peers, turning abstract targets into measurable, immediate goals. Motivation strategies become tactical: advisors get instant feedback, set adjustable personal targets, and take accountability for both revenue and CSI. A modest $15 lift in sales-per-RO—about $1,500 monthly per advisor—proves the ROI of focused behavior change. Transparency from leaderboards drives better customer engagement, raising retention without vague mandates. Act: publish daily rankings, highlight top movers, and tie short-term incentives to leaderboard progress to sustain momentum.
Retention-Focused Communication
Because real-time leaderboards show sales-per-RO, CSI, and customer-pay RO counts at a glance, you can tailor communications that directly boost retention and repeat visits. Use this instant visibility to deploy targeted retention tactics: flag advisors with falling CSI for immediate coaching, and recognize top performers to replicate successful behaviors. Your communication strategies should be personalized and data-driven—share specific metrics with advisors before customer follow-ups so conversations reference recent service value and satisfaction. Monitor customer-pay RO counts to spot churn risk and trigger outreach campaigns or service incentives. Transparency lets advisors confidently compare dealership benefits to independents, strengthening trust. Repeat these cycles weekly to refine messaging, close gaps, and steadily increase loyalty and advisor sales.
Set Clear Goals and Incentives Using Leaderboard Data

While leaderboards give you instant visibility into ROs, hours, and other KPIs, their real power comes from turning that data into specific, measurable goals and incentives. Use goal setting strategies that translate live metrics into daily, weekly, and monthly targets for advisors and techs—ROs per shift, productive hours, upsell rates. Tie those targets to transparent incentive structures: tiered bonuses, extra time-off, or recognition for hitting benchmarks. Monitor individual and storewide trends in real time and adjust goals when data shows consistent over- or under-performance. Make goals challenging but achievable by aligning them with dealership objectives and historical baselines. Reinforce accountability with frequent score reviews and immediate rewards when leaderboards show measurable improvement.
Find and Fix Process Bottlenecks Fast With Live Reports
Start by scanning live reports every 15 minutes to spot where jobs pile up—RO completion times, tech productive hours, or advisor response delays will reveal the weakest links in your service flow. You’ll use real-time fixed ops leaderboards for rapid bottleneck identification and targeted workflow optimization. When a metric spikes, act: reassign techs, prioritize ROs, or adjust shop processes. Visible scores push ownership and faster fixes. Live data lets you validate changes immediately and keep customers informed. Use the table below to track priority areas, current status, immediate action, and owner accountability for continuous improvement.
| Area | Current Status | Immediate Action |
|---|---|---|
| RO Completion | Delayed | Prioritize critical ROs |
| Tech Hours | Underutilized | Rebalance assignments |
| Advisor Response | Slow | Add support coverage |
| Parts | Backordered | Expedite orders |
Measure ROI: 6 KPIs to Prove Leaderboard Impact
Metrics matter: to prove real-time leaderboards are delivering ROI, you’ll track six KPIs that tie visibility to revenue, efficiency, and customer loyalty. Define KPI definitions for CSI, ELR, ROs, $/RO, Tech Efficiency, and throughput so everyone knows what success looks like. Use Data visualization to display trends and Performance benchmarks, making gaps obvious and targets actionable. Run Competitive analysis across teams and locations to drive engagement and refine Engagement strategies that boost ROs and $/RO. Monitor ELR and Tech Efficiency in real time to optimize pricing and coaching, reducing waste and raising margins. Tie improvements to CSI to quantify lifetime value gains. Close the loop with Continuous improvement cycles based on leaderboard insights.
Frequently Asked Questions
What Do Fixed Ops Do at a Dealership?
Fixed ops run your dealership’s service, handling maintenance, repairs, parts, and workflow to boost service efficiency; they track technicians and advisors, reduce turnaround times, and drive customer retention through consistent, measurable service and communication.
What Three Departments Comprise the Fixed Operations of a Dealership?
Service, Parts, and Body Shop — you’ll treat them like engine, fuel, and frame; they boost service revenue and operational efficiency through measurable tasks, clear KPIs, tight inventory control, and swift repairs to drive profitability.
How to Run a Successful Automotive Service Department?
You run a successful automotive service department by prioritizing customer satisfaction, improving service efficiency, investing in technician training, and tracking performance metrics continuously, using data-driven goals, real-time feedback, and targeted coaching to boost productivity and retention.
What Is the Biggest Challenge in Selling Cars Today?
The biggest challenge is market saturation: you’re competing fiercely for fewer buyers, so customer retention becomes critical; you’ve got to use data-driven strategies, optimize service experiences, and act quickly to lock in repeat revenue.
Conclusion
You’re ready to turn data into action, but the real change happens when you actually use it. Imagine dashboards that spotlight lagging techs, advisors who close more RO add‑ons, and appointment retention nudged upward—now picture the quarter after you deploy them. Watch productivity climb, cycle times shrink, and CSI rise. Deploy leaderboards, set targets, incentivize, iterate fast—and you’ll start seeing measurable ROI sooner than you think.