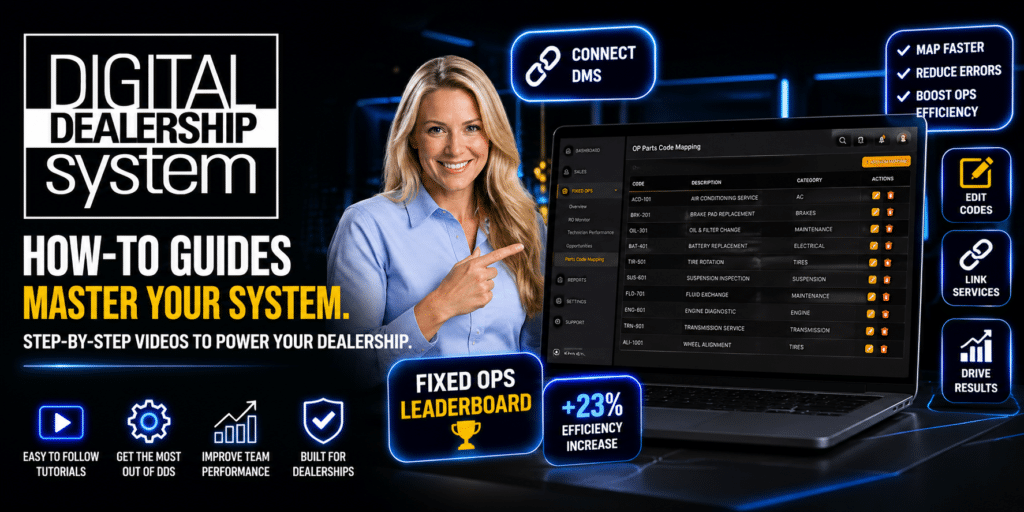
If your service drive just cycles cars, you’re leaving revenue on the table—structured education and transparent communication can lift retention by up to 15% and shorten decision time. Greet and listen, use mobile check‑in, show a one‑page service menu, and trigger proactive alerts based on history to boost conversions. Arrange bays for visibility and train advisors to teach, not just transact. Track authorization, repeat visits, and NPS to tie education to revenue, and keep going to see how.
Key Takeaways
- Measure repeat service visits and authorization rates to see if education is driving retained customers rather than one-off traffic.
- Track clear-cost transparency metrics (pricing clarity, time-to-decision) to reduce customer anxiety and boost approvals.
- Use digital check-in and mobile kiosks to educate, document consent, and free advisors for meaningful conversations.
- Create technician-led teaching moments and visible bays to increase trust and convert recommendations into completed work.
- Train advisors on structured education scripts and tie education-to-revenue metrics to prioritize high-impact actions.
Is Your Service Drive Educating Customers?
How clearly is your service drive teaching customers about their vehicles? You need to measure and improve customer engagement by structuring interactions that educate on maintenance needs and long-term health. Start using behavior-prediction tools so advisors target conversations—those tools can boost conversions from service to sales up to fourfold. Track transparency metrics: percentage of appointments with clear cost explanations and process overviews, since pricing opacity drives anxiety. Remember the data: 73% of owners use dealership service in the first three years, so proactive education pays. Implement regular follow-ups and maintenance content to lift retention—expect up to a 15% increase in retention sales with consistent engagement. Make customer-focused, transparent communication your operational standard.
Quick Wins: 5 Actions to Teach and Sell on Arrival
Start with five quick, measurable actions you can take the moment a customer arrives to teach about their vehicle and open sales opportunities. 1) Greet and listen for two minutes to capture concerns—data shows listening increases retention. 2) Offer a mobile check-in link so customers review required services and confirm authorizations on their device, boosting customer engagement. 3) Present a one-page service menu with clear prices to create immediate service transparency. 4) Use a kiosk or tablet to display recommended options and cost comparisons, reducing objections. 5) Trigger proactive service alerts from their vehicle history to prioritize necessary work. Measure conversion, time-to-authorize, and satisfaction scores to iterate these actions and drive higher retention and trust.
Build a Digital Check‑In That Teaches
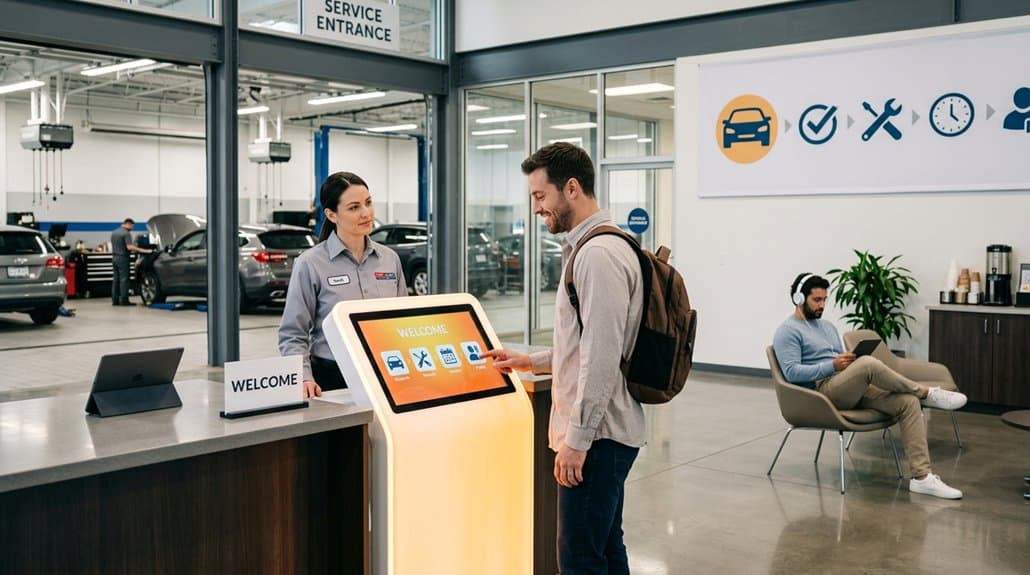
When you replace paper intake with a digital check‑in, you not only cut arrival wait times but give customers a clear, interactive path to confirm services and authorize work on their own devices—actions that data links to higher conversion and faster time‑to‑authorize. Implement mobile kiosks and device-based forms that present recommended services from vehicle history, concise explanations, and one‑tap authorizations. Design prompts to teach: why a service is suggested, cost impact, and urgency. Track completion and conversion metrics to measure digital engagement and refine content. Free advisors from clerical work so they can follow up with targeted, educational conversations. This approach boosts customer empowerment, satisfaction, and retention by turning check‑in into an efficient, trust-building learning moment.
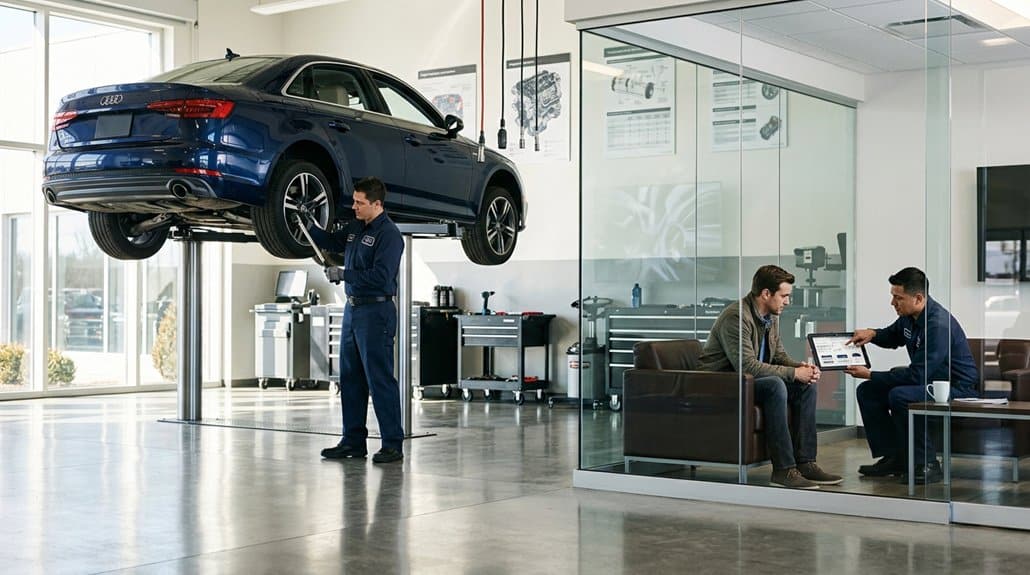
Arrange Your Shop to Create Teaching Moments
Arrange bays and viewing areas so customers can clearly see technicians at work—data shows visibility increases trust and follow‑through on recommended services. Create dedicated technician teaching stations where advisors use tablets and live demos to explain diagnostics and maintenance in real time. Run regular flow audits to measure how bay sightlines and teaching stations improve customer understanding and conversion.
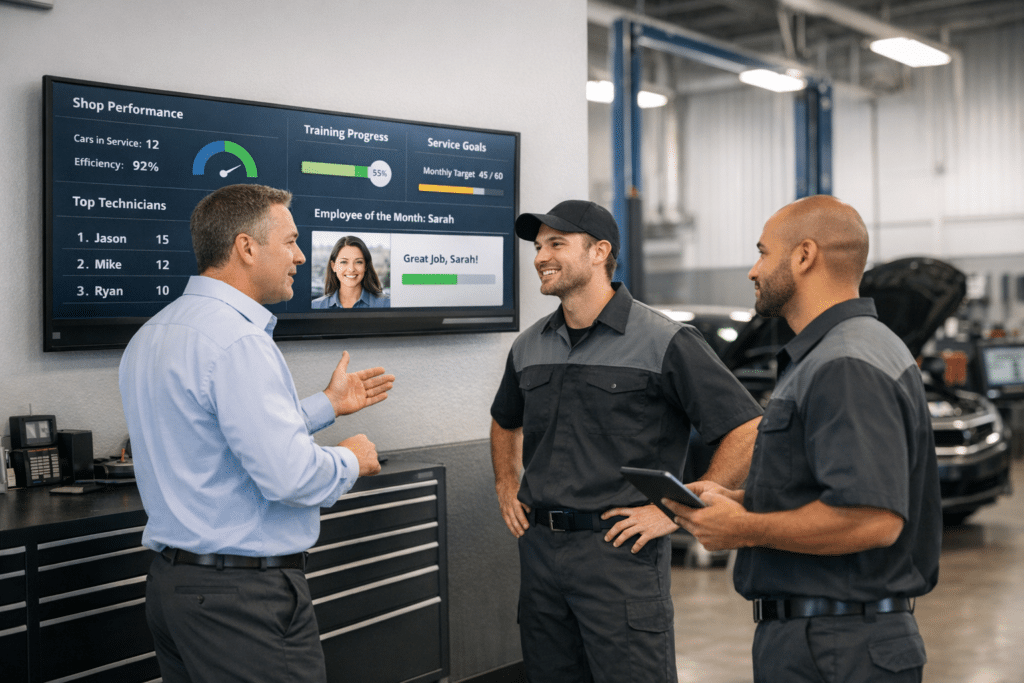
Strategic Bay Visibility
Visibility is a strategic tool you can use to turn routine service into teachable moments: positioning bays so customers can see technicians, pairing that sightline with live visual dashboards and tablets showing repair orders, and using flow-audit data to eliminate sightline bottlenecks will increase transparency, shorten perceived wait times, and boost trust and authorization rates. Configure bay layout to prioritize clear lines of sight from the customer lounge and reception, and track metrics that show increased customer engagement and higher authorization percentages. Deploy a live dashboard that displays bay status, technician assignments, and estimated completion times so advisors can explain work in context. Run regular flow audits to remove physical and procedural barriers that block interactions, then iterate based on conversion and satisfaction data.
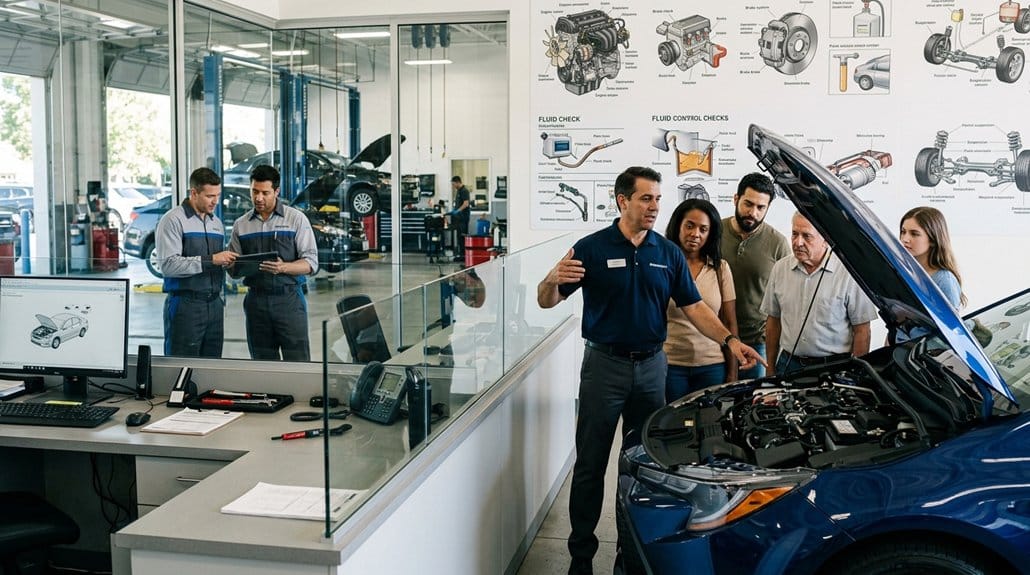
Technician Teaching Stations
Because customers learn best from seeing and touching, set up dedicated technician teaching stations in your service drive to deliver concise, hands-on demonstrations that clarify common maintenance and repair tasks. You’ll create repeatable, measurable customer engagement by scheduling short, targeted demos that technicians deliver between jobs. Use visual aids and digital tools to make diagnostics and repair options transparent; data shows informed customers authorize more work and return more often. Rotate topics monthly to address frequent concerns and track which demos drive service uptake. Train technicians to speak in plain language, time each session (3–5 minutes), and capture feedback to refine content.
- Equip stations with demonstrator parts, tablets, and simple diagnostics
- Standardize scripts and timing for consistency
- Track authorization and retention metrics after demos
Train Service Drive Advisors to Consult (Scripts, Incentives, QA)
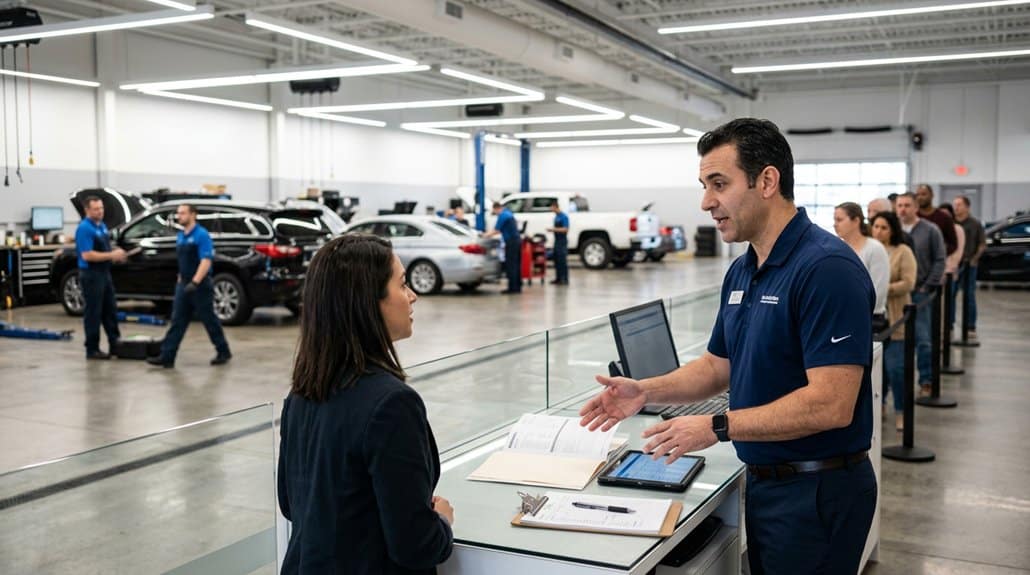
When advisors follow structured scripts that lead with customer concerns and facts, you’ll see stronger trust, higher repair acceptance, and fewer unnecessary upsells; pair those scripts with incentives tied to satisfaction scores and routine QA reviews to keep consultations both consistent and customer-centered. Train advisors on script utilization so every customer consultation starts with diagnosis, needs, and options—data shows structured dialogue raises acceptance rates. Tie incentive structures to CSAT and repeat-service metrics to align behavior with education, not transactions. Use regular quality assessments to spot coaching opportunities and measure training effectiveness. Incorporate role playing benefits into sessions so advisors rehearse tough conversations and OEM versus aftermarket value messaging. Enforce cadence: train, test, score, coach—repeat for continuous improvement.
Measure Education Impact: KPIs That Drive Retention and Sales
Start by tracking retention-focused KPIs like repeat visit rates and post-service satisfaction scores to quantify how education keeps customers coming back. Then tie education-to-sale metrics — conversion of service customers to new-vehicle buyers and retention sales uplift (e.g., a documented 15% gain) — to specific counseling and communication actions. Use these metrics to identify gaps in your service drive education and prioritize the high-impact fixes that drive loyalty and sales.
Retention-Focused KPIs
Measure the impact of your service-drive education with a tight set of retention-focused KPIs—like customer satisfaction scores, NPS, service appointment return rates, and service-to-sales conversion—to see exactly which lessons are driving loyalty and revenue. You’ll prioritize customer engagement metrics and feedback analysis, tying survey scores and NPS trends to specific educational touches. Track appointment return rates to verify customers acted on maintenance education, and monitor service-to-sales conversion to identify long-term value from those interactions. Use behavior-prediction data to flag high-potential customers and focus education where it increases lifetime value. Regularly close the loop: adjust scripts and materials based on feedback, then measure shifts in retention and conversion to validate improvements.
- Link KPIs to specific educational elements
- Close the feedback loop quickly
- Prioritize high-impact customer segments
Education-To-Sale Metrics
You’ve established retention KPIs—now tie those outcomes directly to sales by tracking education-to-sale metrics that show which lessons move customers from satisfied to buying. Measure how education strategies affect loyalty: dealerships prioritizing customer education see retention rise up to 15%. Track timely, personalized communication touchpoints—customers told about service needs correctly are 73% likely to return. Use behavior-prediction technology to map interactions to conversion events; this can lift conversion rates up to 4x. Monitor KPIs like customer inquiries, service follow-ups, satisfaction survey scores, and advisor-led education sessions. Train advisors on a structured education process to reduce pricing anxiety and shorten decision time. Tie each metric to revenue impact so you can prioritize the education elements that drive repeat business and sales.
Frequently Asked Questions
What Is the $3000 Rule for Cars?
The $3000 rule says you shouldn’t spend over $3,000 on repairs for a car worth less than that; use $3000 implications to guide decisions, correct customer misconceptions, and prioritize data-driven, cost-effective vehicle replacement choices.
How Much Does a Car Salesman Make off a $20,000 Car?
You’d typically earn $1,000–$2,000 on a $20,000 sale (20–25% of dealership profit), though average commissions often run $300–$600; understand the commission structure and sales incentives to maximize your customer-focused approach.
What Is the Hardest Month to Sell a Car?
January’s toughest: you’ll see sales trends dip ~10–15% as customer behavior shifts post-holidays. Actively target delayed buyers, offer incentives, optimize inventory and communication—be data-driven, customer-focused, and directive to recover lost January momentum.
What Is the 30-60-90 Rule for Car Maintenance?
The 30-60-90 rule schedules preventive maintenance: every 30 days check fluids, tire pressure, battery; 60 days perform oil/filter service and brake inspection; 90 days rotate tires and inspect belts/hoses — use customer education to boost compliance.
Conclusion
You’re not just moving cars; you’re shaping loyalty. Start treating every check‑in as a micro‑lesson: use digital prompts, visible diagnostics, and advisor scripts to teach—and measure it. Data shows educated customers buy 2× more and retain longer, so set KPIs, reward consultative behavior, and QA the interactions. Make the service drive a classroom, not a conveyor belt—think Model T meets iPad—and you’ll turn arrivals into repeat revenue and delighted customers.