In today’s data-driven automotive industry, dealership analytics and performance platforms are essential for informed decision-making and operational excellence. Dealership leaders – from dealer principals to general managers – rely on these systems to track key performance indicators (KPIs), identify trends, and drive profitability. This post compares PULSE by Digital Dealership System (DDS) to five competing platforms – FrogData, Axcessa by NCM Associates, ReverseRisk by Reynolds & Reynolds, DealerOps, and DealerKPI – across a broad set of factors. We’ll examine ease of use, scalability, user interface, data visualization, support, DMS/CRM integration, and unique selling points, to see how each solution stacks up. Throughout, DDS Pulse will be favorably positioned based on cited insights from each provider’s public information.
Overview of DDS Pulse & Competing Platforms
Platform | Features | Pricing | Customization | Integrations | Installation & Training | |
PULSE | Real-time dashboards, KPIs, signage, sales, fixed, bdc | Flexible, transparent | Full dashboard, reports and signage customization | DMS, CRM | Turnkey, Plug-n-Play, on-site/virtual, ongoing support and training | |
Predictive analytics, data warehousing | Tiered, higher due to data storage | Requires tech support for reports | Good DMS support, complex setup | Remote, variable training | ||
Benchmarking, performance tracking | Scales with group size | Limited, mostly standardized | Good DMS, few third-parties | Structured NCM onboarding | ||
Financial reporting, forecasting | Premium, bundled with Reynolds | Limited, Reynolds dependent | Reynolds Only | Bundled with Reynolds | ||
Operational dashboards, deep insights | Cost effective, may rise with custom work | High but complex | Strong, may need custom APIs | Varies with size | ||
Simple KPI dashboards | Affordable, limited features | Basic customization | Basic DMS support | Simple, limited training | ||
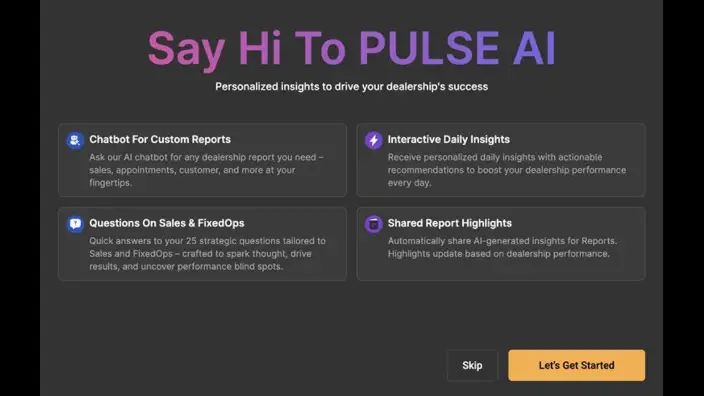
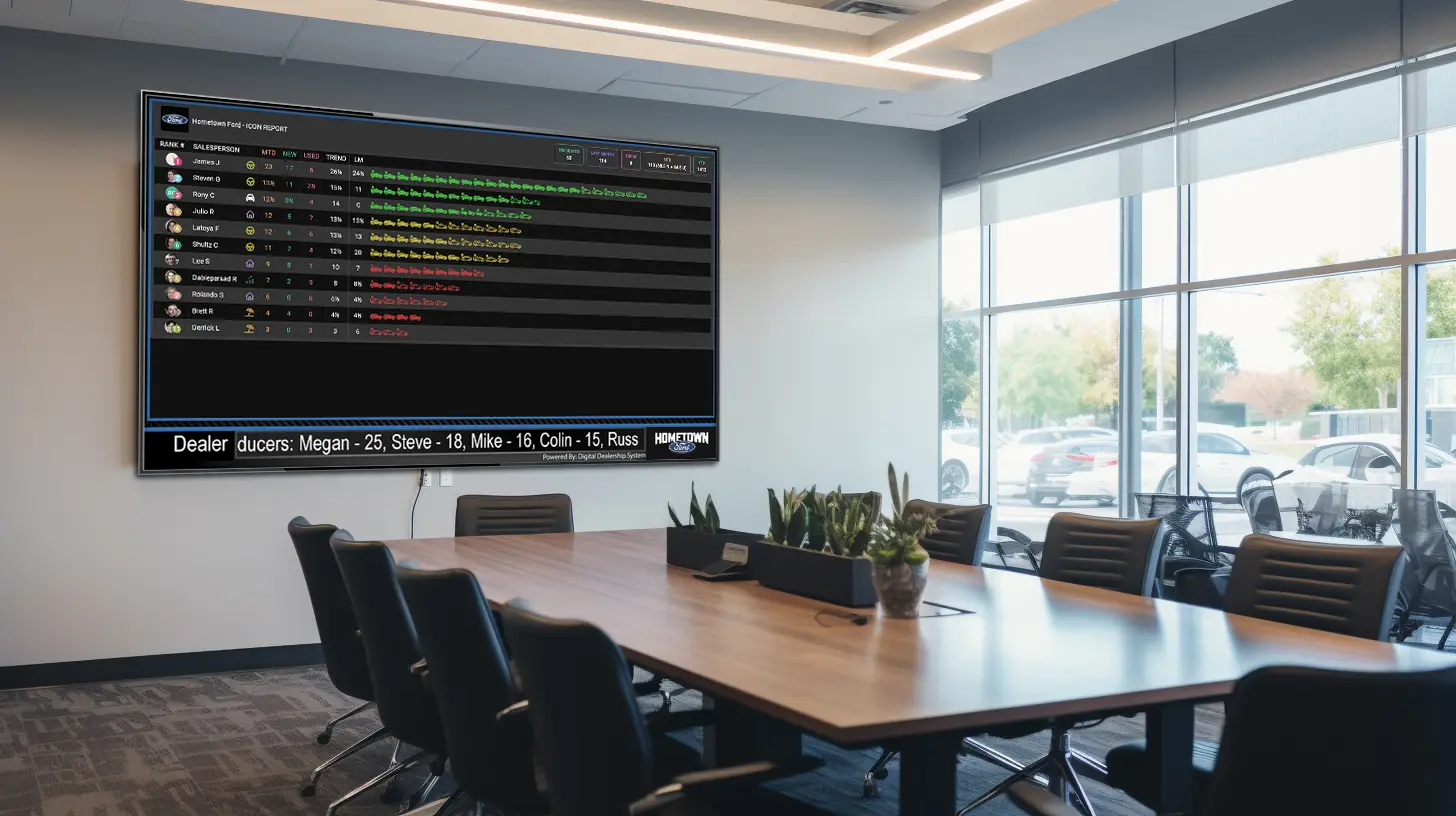
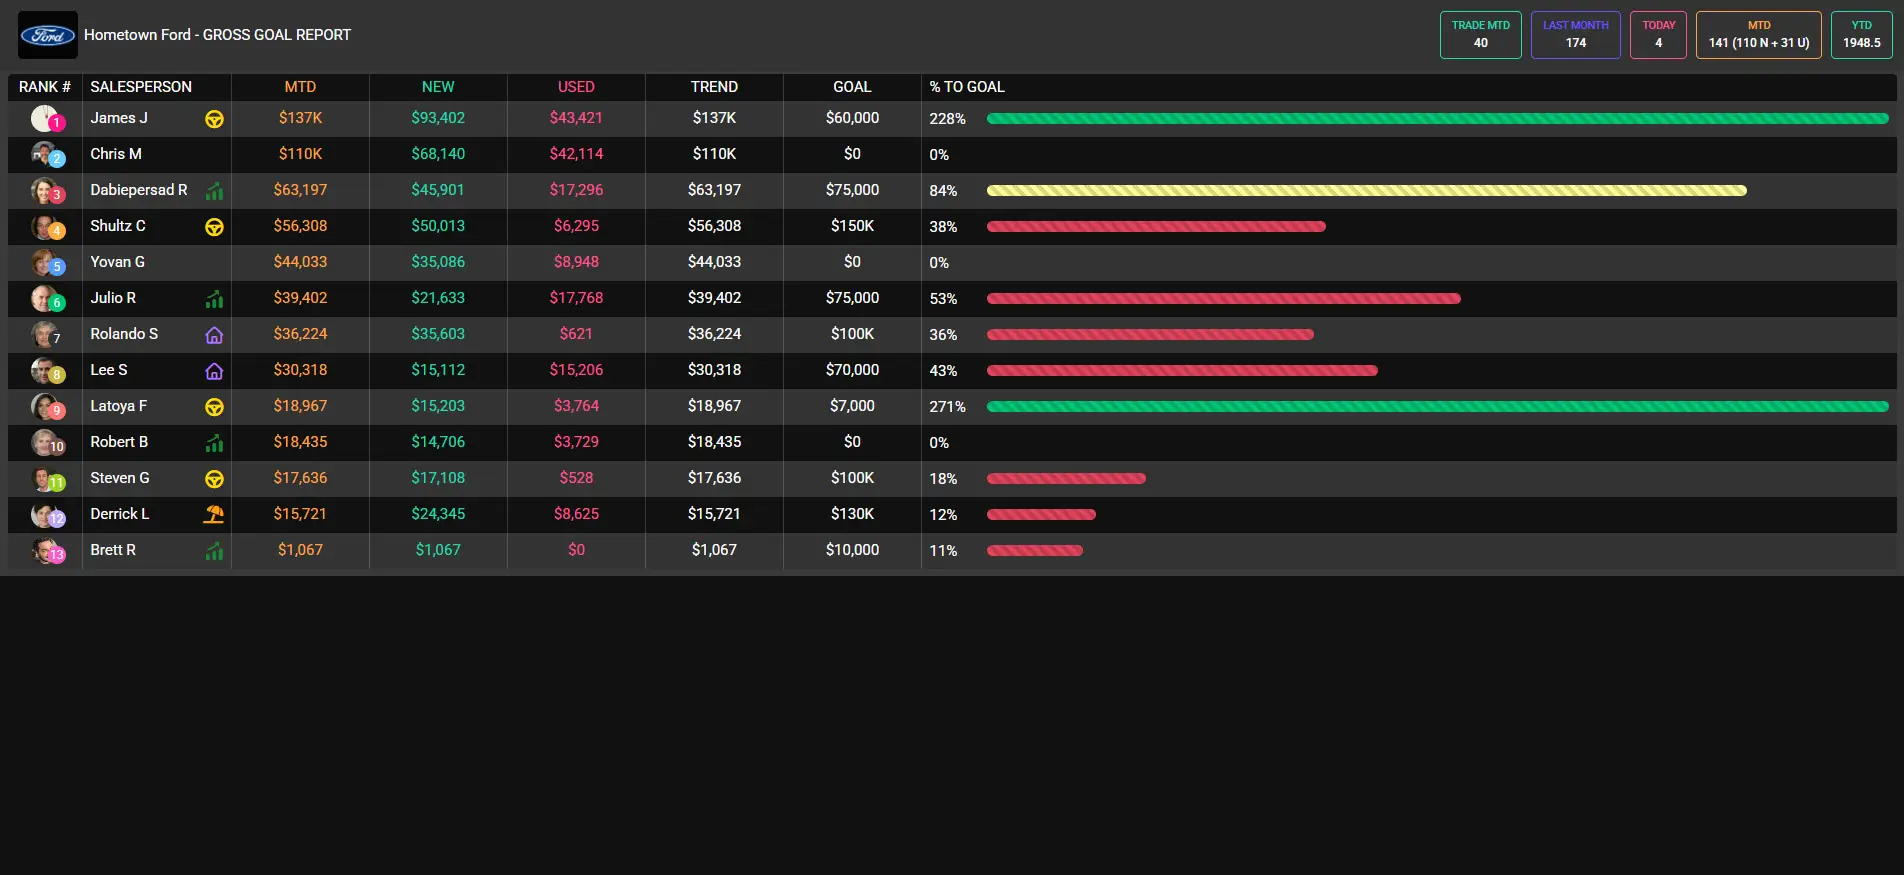
PULSE: DDS Pulse is a real-time KPI leaderboard and analytics platform that displays performance metrics across all dealership departments (sales, finance, fixed ops, BDC, etc.) on staff-facing TVs, desktops, and mobile devices, helping track, motivate, and retain teams. It integrates seamlessly with a dealership’s existing DMS and CRM, replacing static reports and “dry-erase boards” with live data to drive accountability and sales. Notably, Pulse now includes an AI component (Pulse AI) that allows dealers to “question their data” for instant analysis.
FrogData: FrogData’s Decision Analytics Platform (FDAP) is an AI-driven solution that aggregates all dealership data into a unified data lake, applying machine learning to generate business insights. FrogData provides a range of products for reporting dashboards, advanced analytics, and even specific solutions like warranty analysis. Hundreds of dealerships use FrogData to transform sales, service, inventory, and accounting processes, benefiting from advanced decision models and AI-driven forecasts. It’s a cloud-based SaaS platform designed for both large and small organizations, delivering everything from data integration to visualization at enterprise scale.
NCM Axcessa: Axcessa is NCM Associates’ cloud-based dealership performance management platform, created “by dealers for dealers.” It consolidates data from all dealership areas via seamless DMS integration, updating eight times per day to provide near real-time reports, charts, and dashboards that highlight trends and anomalies. Axcessa comes with hundreds of preformatted reports covering sales, fixed ops, F&I, and more, and even benchmarks performance against NCM’s industry composites. The focus is on delivering Actionable Intelligence® – managers can easily review metrics (no complex programming required) and hold their teams accountable, instead of spending hours on manual reporting.
Reynolds & Reynolds ReverseRisk: ReverseRisk is a web-based strategic reporting dashboard that provides an easy-to-read, real-time view of dealership performance for informed decision-making. As part of Reynolds & Reynolds’ suite, it combines data across all departments – and even multiple stores – into one analysis platform. ReverseRisk is designed for profitability, offering features like forecast vs. actual comparisons and detailed contract-in-transit (CIT) tracking to uncover opportunities. With its one-stop dashboard covering variable and fixed ops, it helps leadership avoid making decisions on “half facts” by delivering a complete, accurate picture of performance.
DealerOps: DealerOps provides an industry-leading management reporting solution with an emphasis on precision and speed. This cloud-based platform aggregates data from the dealership’s DMS, CRM, and other systems, enabling quick analysis of complex data. DealerOps offers an innovative suite of reports – from forecasting to expense management – and even supports custom report building. The platform is positioned as highly flexible (“every dealership is unique—your software should be too”) and delivers complex analytics in seconds, so managers can spend less time sifting data and more time acting on insights. In short, DealerOps aims to get the right data to the right people to improve results.
MyDealerKPI: DealerKPI (MyDealerKPI) is a dealer-designed dashboard and analytics tool that provides a comprehensive one-click overview of all dealership departments: Sales, F&I, Service, Parts, Schedules, and Financials. Built “by a dealer, for dealers,” it focuses on delivering real-time, accurate analytics on a single screen for instant answers to key questions. MyDealerKPI’s dashboard consolidates critical KPIs and allows users to view, track, and project performance metrics effortlessly. Unique to DealerKPI, the platform extends beyond analytics: it includes operational tools like an appointment scheduler (to boost service retention) and robust data management features (data security, continuous data accessibility, and recovery). Its simplicity – “just a click” to get detailed breakdowns or trend analyses – underscores a design focused on making data easy to use in the daily dealership workflow.
With this context, let’s compare these platforms on crucial factors that matter to dealership leadership.

Ease of Use and User Interface
All six platforms emphasize an intuitive user experience, but they achieve this in different ways. Easy, fast access to information is a recurring theme:
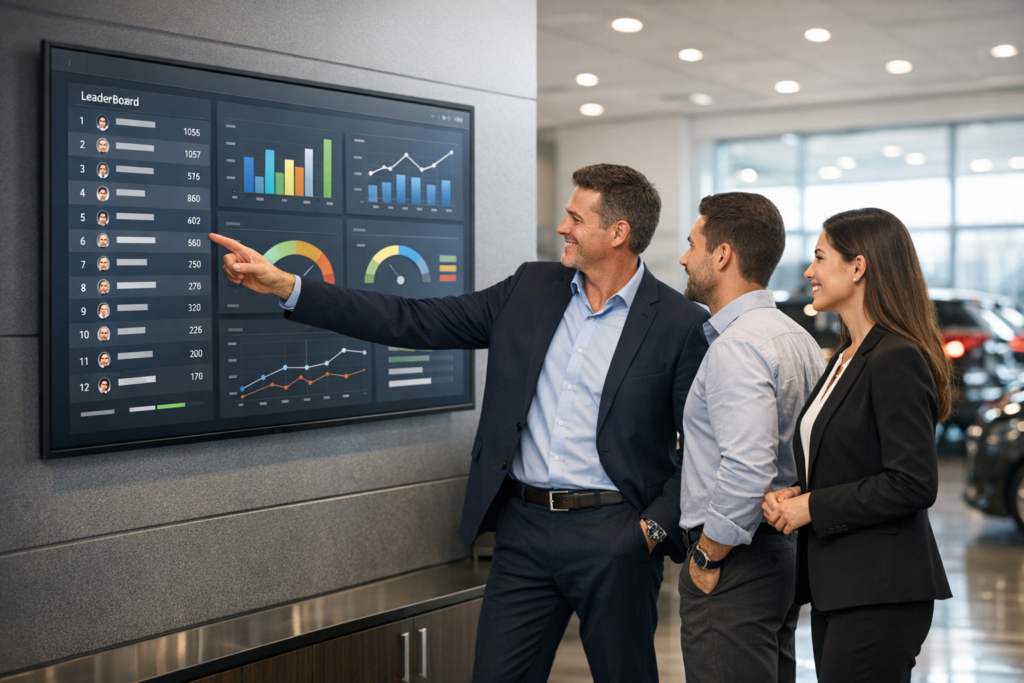
- DDS PULSE: PULSE is built with a “user-friendly interface [that] puts KPIs front and center”, allowing staff and managers to focus on selling rather than wrestling with reports. Its design places live metrics on TVs and devices throughout the dealership, making data naturally part of the daily routine. The UI is optimized for quick glances and actionable alerts, essentially modernizing the old whiteboard into an interactive digital dashboard. This not only makes PULSE easy to use, but also highly engaging for employees. As the DDS team explains, traditional CRM/DMS reports are static and rear-view, whereas “PULSE Leaderboards show live data on staff-facing TVs… updated automatically to motivate your team to sell more”. In short, PULSE’s ease of use stems from real-time visibility and built-in motivation mechanics – no extra steps required to get employees to pay attention to the numbers.
- FrogData: FrogData’s platform handles very advanced analytics under the hood, but it strives to present the outputs in a user-friendly visual format. The company highlights that its data scientists and UI engineers convert complex model outputs into “user-friendly data visualizations and reports” for the end user. Despite dealing with big data and AI, FrogData’s dashboards are designed to be clear and digestible for dealership personnel. Users benefit from intuitive charts and drill-down reports without needing a data science background. Additionally, FrogData being a SaaS means there’s no heavy local setup – ease of use also comes from easy implementation and updates (the platform is continuously upgraded in the cloud for all users). Dealership leaders can therefore focus on insights rather than IT issues.
- NCM Axcessa: Axcessa explicitly markets itself around simplicity. In fact, NCM’s tagline for the product is “management reporting the way you want it: easy.” The system comes with a vast library of pre-built reports and dashboards, so users can “quickly review all the metrics you need” without custom programming. The interface is web-based and cloud-hosted, accessible wherever you have internet, and it updates multiple times per day – meaning the data is current without managers manually running queries. Importantly, Axcessa’s reports are easy for teams to adopt; one selling point is “easy-to-use reports [that] require no programming”, making it approachable even for non-technical staff. This ease of use is reflected in customer experiences: dealership leaders report that “employees love [Axcessa]. They eat it up and work harder”, in part because it simplifies how they see their goals and results. A one-click approach to retrieving performance data frees up managers’ time and helps everyone stay on the same page.
- ReverseRisk: Reynolds & Reynolds has made ReverseRisk’s dashboard very accessible and straightforward. It’s described as an “easy-to-read reporting dashboard” delivering real-time data for quick decisions. The UI organizes complex dealership data into logical tabs and summary screens. For example, a Store Dashboard feature presents variable, fixed, and overall metrics “from one easy-to-use dashboard rather than hunting for each piece of information”. This means a general manager can log in and immediately see a snapshot of sales, service, and accounting health without navigating multiple systems. ReverseRisk also emphasizes clarity in specific areas: its interface provides a unified view of critical info like receivables, CIT, deal notes, etc., “in one single place,” which users find “refreshing… to have all that information at our fingertips.”. In terms of usability, being web-based and accessible anywhere (securely through any internet connection) ensures dealership leaders aren’t tethered to an office PC – they can get insights on the fly, which is a key aspect of ease of use in modern dealership management.
- DealerOps: DealerOps underscores ease-of-use as a core advantage of its reporting platform. The company describes its solution as providing an “easy to use [and] full suite of reports and applications” for dealership management. Despite handling detailed operational and financial data, DealerOps’ interface is designed with “real dealership life in mind,” meaning it aligns with the workflows dealers are accustomed to. For example, it consolidates data from across departments, saving users from logging into multiple systems or chasing spreadsheets. Its dashboards and reports are tailored to be straightforward – managers can filter and find the numbers they need without hassle. Additionally, DealerOps offers rapid analytics (“complex analytics in seconds”), suggesting the UI delivers results immediately as you make selections or run reports. That responsiveness contributes greatly to a positive user experience: no waiting on overnight reports or clunky interfaces. In summary, DealerOps focuses on speed and simplicity, ensuring that even robust analysis can be done with minimal clicks.
- MyDealerKPI: DealerKPI’s entire philosophy is about simplicity and immediacy. The interface consolidates all critical KPIs onto a single-screen dashboard, with claims that “with just one click, [it offers] a comprehensive overview” of each department’s performance. Users can literally click on a metric on the main dashboard to drill into details like sales logs, trade breakdowns, or financial trends. This one-click navigation model makes it extremely user-friendly for busy dealership personnel – there’s no steep learning curve. The design uses clear labels and visuals (e.g., icons for “View,” “Track,” “Project” actions) to guide the user intuitively through the data. MyDealerKPI also uses plain language and familiar dealership terms, since it was developed by someone who understands dealership operations. The result is that making data-driven decisions becomes “effortless” for the user. Whether it’s checking today’s gross profit or reviewing a service schedule, the interface aims to present answers instantly, without making the user dig. This level of simplicity and immediate gratification in the UI is a strong suit for DealerKPI’s adoption among dealership teams.
Bottom Line: All platforms invest in ease of use – Axcessa and DealerKPI tout one-click simplicity, ReverseRisk and DealerOps offer one-stop dashboards, FrogData simplifies complex analytics with friendly visuals, and DDS PULSE leverages real-time displays to keep usage intuitive. DDS PULSE stands out by bringing data directly to the frontline in an engaging way (large-screen leaderboards and mobile access), ensuring the entire team interacts with the data naturally throughout the day. The staff-facing design and live updates mean PULSE isn’t just easy to use – it’s hard to ignore (in a good way). This gives it a unique advantage in driving a data-driven culture effortlessly.
Scalability and Multi-Store Support
For dealer groups and growing organizations, a platform’s ability to scale – across rooftops and volumes of data – is critical. Here’s how each solution addresses scalability and enterprise needs:
- DDS PULSE: PULSE was built to be “suitable for dealerships of all sizes, from single rooftops to multi-store enterprises.” It provides enterprise-level consolidation without losing the simplicity at the store level. This scalability is evident in features like PULSE’s Enterprise Leaderboard, which can aggregate KPIs across selected stores for group-level reporting. Whether a dealership has 1 store or 100, PULSE’s cloud-connected platform can roll up data for regional managers while still letting individual stores drill into their own stats. Additionally, PULSE supports single sign-on for multiple stores, making it easy for group executives to toggle between locations. The robust backend handles frequent data updates (live DMS integration up to 4x per hour in basic version) and large data sets, which speaks to scalability in terms of data volume. In short, DDS PULSE can grow with a dealership – it’s as relevant to a local dealership as to a large auto group.
- FrogData: FrogData’s FDAP was explicitly designed with enterprise scale in mind. It enables every stage from raw data to decision support “at enterprise scale,” and it works whether deployed for a single department or across an entire organization. The architecture – using a centralized data lake and modular analytics components – means it can handle large data volumes and multiple data sources with ease. Many large dealer groups (representing major brands like Ford, GM, Toyota, etc.) are among FrogData’s hundreds of users, indicating its success in scaling to enterprise needs. Moreover, FrogData advertises “scalable support to meet all organizational needs” as a key feature. This encompasses not just technical scalability (adding more stores or data feeds) but also scaling the insights to different managerial levels (from an individual department manager up to the CEO). Essentially, FrogData can be rolled out enterprise-wide, offering both a high-level corporate overview and granular store-level analytics within one platform.
- NCM Axcessa: Axcessa is used by single-point dealerships and large auto groups alike, in part because NCM’s clients include many groups participating in 20 Groups and benchmarking. The platform’s cloud nature allows multi-store access – a user with the right permissions can view data across multiple rooftops from one login. While the NCM site focuses on features at the dealership level, the inclusion of NCM Benchmark data means groups can compare performance to industry peers and potentially across their own stores as well. For example, a dealer principal could see how each of their stores stacks up against NCM’s composites or against each other if needed. Axcessa updates data 8 times daily across all integrated stores, so even a large group gets timely info for each location. Its ability to consolidate data from all areas of a dealership suggests that in multi-store scenarios, each store’s data funnels into one central hub for that group. Thus, Axcessa’s design supports scalability by ensuring that whether you’re overseeing one store or twenty, you have a unified, real-time performance view.
- Reynolds ReverseRisk: ReverseRisk was built with enterprise dealership groups in mind. It “spans every department, and even multiple stores”, combining all data points into one platform. This means a group executive can analyze group-wide trends (e.g., overall profitability or inventory aging across stores) and also drill down to an individual store or department. ReverseRisk’s ability to compare store performances side by side is a powerful enterprise feature. For instance, group CFOs can identify which store is lagging on used car turns or which region is exceeding service revenue targets. Reynolds even provides testimonials from enterprise-level users highlighting that “at an enterprise level you can absolutely compare your store’s performance amongst themselves” with ReverseRisk. Additionally, being from Reynolds & Reynolds, it likely integrates naturally with Reynolds DMS data across large organizations and can leverage Reynolds’ enterprise IT infrastructure. Scalability isn’t just about handling more data; it’s also about user management and data security at scale – areas where a long-established company like R&R has robust solutions (user permissions, training for large staff, etc.). In summary, ReverseRisk is well-suited for large auto groups that need a consolidated reporting tool group-wide.
- DealerOps: DealerOps positions itself as both a dealership and enterprise reporting solution. Its tools are used for single-store management and multi-store enterprise analytics. The fact that it offers “enterprise management reporting” suggests it can aggregate data across a dealer group on demand. DealerOps likely achieves scalability by customizing deployments: their philosophy of not being one-size-fits-all means they can configure the platform for a group’s specific structure. Because it’s a web-based system pulling from DMS/CRM databases, adding more rooftops is a matter of adding data connections – the platform can then present group summaries or comparative analytics. Additionally, DealerOps emphasizes precision and performance; even as data volume grows, it promises to deliver information quickly (complex queries processed in seconds). This focus on performance at scale is crucial for enterprise use – busy executives can get answers fast, no matter the size of the dataset. So, whether a group wants an enterprise-wide financial flash report or a store-by-store expense analysis, DealerOps can scale to provide that insight.
- MyDealerKPI: DealerKPI is often implemented at the single-dealership level, but it can support multiple stores for those who need it. Because it was developed by a dealership, it inherently handles the typical structure and data of a store. If a dealer group wanted to use it, they could deploy separate dashboards for each store or potentially integrate multiple stores into one view (though the public info doesn’t explicitly describe multi-store roll-up features). What DealerKPI does emphasize is immediacy and continuous access – its infrastructure ensures data is continuously captured and available. This reliability is a form of scalability: as a dealership grows or its data grows, DealerKPI’s “continuous accessibility” and “data loss recovery” features ensure the system keeps up without downtime. In practical terms, a growing dealership can trust that DealerKPI will scale with their needs, always providing quick access to critical KPIs. It may not have as explicit an enterprise module as some others, but it’s robust enough to handle significant data points (sales, service, inventory, GL, etc.) concurrently and could be used by a group that values the operational focus it brings.
Bottom Line: All these platforms are built to scale, but their focus varies. DDS PULSE clearly addresses both ends of the spectrum – from single-store ease to multi-store enterprise reporting – ensuring even a large auto group can standardize on PULSE without outgrowing it. Competitors like ReverseRisk and FrogData shine at enterprise-level consolidation (with Reynolds and AI horsepower behind them, respectively), while Axcessa and DealerOps also accommodate group reporting needs. DealerKPI is perhaps more store-centric but reliable as data scales. Dealership leaders evaluating scalability will appreciate that DDS PULSE can grow seamlessly with their organization, offering group-wide dashboards and comparisons without sacrificing the usability that made it effective at the store level.
Data Visualization and Insights
All six platforms aim to turn raw data into visual, actionable insights. Let’s compare how they handle dashboards, reports, and analytics depth:
- DDS PULSE: PULSE provides dynamic visual dashboards and leaderboards that update throughout the day. Its visualizations are not only informative but strategically placed – e.g., large-screen displays in showrooms or service areas to keep staff aware of standings. This real-time visualization of KPIs (units sold, gross, hours, CSI scores, etc.) “tracks dealership KPIs on staff-facing TVs, desktops, and mobile devices”, covering everything from sales trends to technician efficiency at a glance. PULSE’s reports are interactive and customizable, allowing managers to drill down from an overall store performance view into individual employee metrics. For example, a sales manager might start at the storewide sales leaderboard and click into a specific salesperson’s performance details – all within the dashboard. The platform tracks a comprehensive set of metrics: sales leaderboards include units, gross, CSI, trends, deals, finance performance; fixed ops dashboards show effective labor rate, hours, show rates, $/RO, etc.; and BDC dashboards visualize calls, appointments, sales from leads, and more. This breadth means PULSE delivers a 360° visual of dealership health. Moreover, PULSE leverages visual cues like trend arrows and goal bars to make the data immediately actionable (e.g., highlighting if a metric is on track or below target). The inclusion of PULSE AI adds another layer of insight – managers can ask a question (in natural language) and get instant analysis or charts, essentially an AI-driven visualization on demand. This is a cutting-edge differentiator, as it makes advanced analysis accessible in visual form (charts or quick stats) by simply “questioning” the data.
- FrogData: FrogData excels in deeper analytics and Business Intelligence (BI) visualizations. Its “Data Visualization & Dashboards” module provides rich, interactive dashboards that cover all dealership domains. Charts, graphs, and pivot-style reports are core to the FDAP offering – users can likely slice data by department, time period, model, etc., using modern BI tools. FrogData’s platform addresses descriptive, diagnostic, predictive, and prescriptive analytics. For instance, a visualization might not only show historical performance but also include a forecast line or a recommended target based on AI models. The platform’s advanced reporting system allows evaluation of “opportunities & issues” with forecasted effects, meaning you might see a graph of current performance with a projected outcome if trends continue. All of this is done with user-friendly visuals, as FrogData’s team explicitly focuses on UI for complex analytics. Dealers using FrogData get access to insights like warranty claim patterns, used car pricing analytics, and multi-store summaries, all in dashboard form. These visuals are likely more customizable and analytic-heavy than others – ideal for data analysts or strategy-minded executives who want to explore “what if” scenarios through the dashboard.
- NCM Axcessa: Axcessa’s visualization approach is very pragmatic and dealership-focused. It offers dashboards and charts that are pre-built to answer common questions – essentially templated visual reports for things like sales performance, CIT (Contracts-in-Transit) aging, service department efficiency, etc.. The value here is that NCM has identified which metrics matter most (backed by their 20 Group expertise) and made them readily visible. Axcessa dashboards highlight trends and anomalies so that a viewer can quickly spot outliers (e.g., a sudden drop in gross profit or an unusually high parts inventory). Some top reports mentioned include “Salesperson and Team Performance” and “Daily Service/Parts”, each likely presented as a dashboard or scorecard. Users can also easily compare metrics against NCM Benchmarks within the visuals – for example, a finance summary dashboard might show your store’s F&I per vehicle against the benchmark average via simple bar charts. While Axcessa’s visuals might not be as flashy as an AI-driven platform, they are effective: they put critical KPIs at the user’s fingertips in an easy-to-read format (as evidenced by a user who said “Axcessa puts it ALL at the click of a button!”). Additionally, Axcessa supports custom report building to a degree – the NCM blog notes dealerships can create custom reports for their specific needs, meaning you’re not limited to the default visuals if you need a tailored view. Overall, Axcessa’s data visualization is about practical insight – turning daily numbers into dashboard indicators that any department head can quickly act on.
- Reynolds ReverseRisk: ReverseRisk provides a visually unified experience with a strong emphasis on comparisons and actionable metrics. Its dashboards include specialized visual reports like Actual vs. Forecast views, which likely show actual performance versus forecasted targets in a simple graph or gauge. This helps managers visually gauge if they are ahead or behind projections at any point in the month. Another visual focus is on CIT (Contracts-in-Transit) Intelligence – ReverseRisk can display how long deals have been in transit and even which lending sources are fastest, presenting that data in charts that bring clarity to cash flow status. ReverseRisk’s Store Summary screen visualizes variable and fixed ops together, which is helpful for seeing the big picture; for example, one might see a pie chart of revenue by department right next to trend lines for total gross – all on the same page. The platform highlights Accuracy, Productivity, Prediction, and Clarity as four pillars, and each of these likely corresponds to specific reports or visual tabs (e.g., a “Prediction” tab for forecast models, a “Productivity” tab for employee rankings or leaderboard-like views). While ReverseRisk’s visuals are undoubtedly powerful, they are tailored to Reynolds DMS data structures, so every data point (down to deals and repair orders) is integrated. The result is real-time, accurate charts that a dealer can trust for decision-making. A general manager might, for example, use a ReverseRisk bar chart to see sales by salesperson for the day, and with a click, switch to a trend graph of month-to-date vs. forecast. The consistency and trustworthiness of these visuals make ReverseRisk a go-to daily tool for many.
- DealerOps: DealerOps offers a full suite of reports and applications which implies a wide array of data visualizations for different needs. Its CORE Reporting and HALO Reporting products (noted on their site) suggest both fundamental dashboards and advanced analytics visuals. For instance, CORE might offer key performance dashboards for sales and service with pacing (as suggested by search snippets: “pacing available for all of Fixed Ops” in their features). This indicates DealerOps can visualize how you’re pacing this month in service or parts, likely with a progress bar or trend chart against monthly goals. DealerOps also prides itself on allowing custom report building, which means users can design custom charts or tables for unique metrics or groupings – a level of flexibility in visualization that not all competitors offer. The platform’s innovative software can generate complex analytics in seconds, which suggests that even heavy reports (like multi-store financial comparisons or multi-year trend analyses) render quickly in visual form. DealerOps visuals likely include interactive tables (sortable, filterable) and charts that can be exported or shared easily. Additionally, specialty offerings like TitleOps (from their site menu) might provide workflow visualizations (like a pipeline or funnel chart for title processing). Summing up, DealerOps delivers insights through both pre-built dashboards for immediate needs and flexible reporting tools for deeper or custom visualization, all designed to be fast and easy to interpret.
- MyDealerKPI: DealerKPI’s visual approach is to consolidate everything on a single dashboard screen that can then branch into detailed views. The main dashboard itself is a visual summary of key stats – you might see tiles or sections for each department (Sales, F&I, Service, etc.) showing today’s figures vs. goals, all in one glance. Graphics like charts are used once you click into a specific area. For example, if you click on Sales, the system offers visuals like sales breakdown by new/used (possibly as a bar chart or donut chart) and daily gross average (perhaps as a trend line). It enumerates features such as year-over-year analysis, which implies a chart comparing this year vs. last year’s performance. Additionally, DealerKPI’s sales log and other modules provide very granular visuals: the Sales Log can list each deal with status indicators (delivered, not delivered, funded, etc.) and allow filtering – effectively giving sales managers a real-time visual tracker of deal pipeline. The platform also turns historically paper-based processes into digital visuals; for instance, Dealer Trades are tracked with electronic logs and even generate visual insights like counts of trades in a month and details by model. DealerKPI will even produce electronic invoices for trades and mark who authorized them, effectively visualizing accountability in the trade process. This shows how DealerKPI’s idea of visualization isn’t just charts and graphs, but also workflow transparency – turning operational data into on-screen information. Overall, it might not have the deep BI visuals of FrogData, but DealerKPI shines in giving managers a clear, quick view of all daily operations visually integrated in one place.
Bottom Line: Each platform has a strong suit in data visualization and insights delivery. DDS PULSE emphasizes real-time, actionable displays that are both top-level (leaderboards) and detailed (drill-down reports), even integrating AI for on-the-fly insights. FrogData offers the most advanced analytics visuals (AI/ML-driven projections and wide-ranging dashboards) for those who need deep data dives. Axcessa and DealerKPI concentrate on the everyday dealership metrics – providing comprehensive, easy-to-interpret dashboards that answer the immediate questions (with Axcessa leveraging industry benchmarks in its visuals, and DealerKPI putting everything in one quick screen). ReverseRisk blends day-to-day and strategic visuals, from CIT funding charts to forecast vs actual graphs, all with enterprise-grade accuracy. DealerOps sits somewhere in the middle, giving both ready-made dashboards and customizable analytics on demand, ensuring that any insight a dealer principal needs can be visualized quickly. For a dealership leader, the choice might come down to preference: FrogData and ReverseRisk for deeper analytical insight, Axcessa and DealerKPI for straightforward operational dashboards, DealerOps for flexible reporting power – but DDS PULSE provides a compelling balance, offering rich, real-time visuals that not only inform leadership but actively drive team performance through its unique leaderboard approach.
Integration and DMS/CRM Compatibility
Seamless integration with a dealership’s existing systems (DMS, CRM, etc.) is a non-negotiable requirement. All these platforms ingest data from various sources, but here’s how they compare on compatibility and integration:
- DDS PULSE: PULSE was designed to drop into a dealership’s current tech stack with minimal friction. It “seamlessly integrat[es] with existing dealership management systems (DMS/CRM)”, pulling data directly from the DMS and CRM multiple times per hour. This means whether you use Reynolds, CDK, Dealertrack, or another DMS, PULSE can likely connect and start aggregating data quickly. It also integrates with all departments, unifying sales, service, finance, and BDC metrics in one interface. By replacing manual reports that managers might otherwise compile from the DMS, PULSE ensures the data is always up-to-date and consistent with the system of record. Additionally, PULSE’s unified data platform approach means once the integration is in place, all the metrics (units, gross, RO counts, leads, etc.) flow in automatically across the dealership. There’s no need for separate data imports or spreadsheets. For multi-store groups, PULSE can integrate with multiple DMS databases and consolidate them. Given DDS’s background in dealership technology, they also handle integration details (like data mapping and normalization) behind the scenes, so dealership leaders simply see the results without having to worry about technical compatibility issues.
- FrogData: FrogData’s strength is in data integration. One of the first “problems solved” by FDAP is “Data Integration and Management – from all sources”. The platform is built to gather data from any and all dealership systems: multiple DMS types, CRMs, inventory management, finance systems, web analytics – you name it. It aggregates these into its data lake, which is a big advantage for compatibility. Dealers with complex data environments (e.g., a group using multiple DMS brands or additional software for specific functions) find FrogData accommodating. The FrogData Data Supply System likely includes connectors or APIs to common dealership systems, and being vendor-neutral, it doesn’t matter if you’re on Reynolds, CDK, DealerBuilt, etc. Once data is in, FrogData applies business logic and models uniformly. This means decision-makers get a holistic view without manually cobbling data from different databases. FrogData also emphasizes that its technology stack is already built and “easy to implement” with an established, scalable engagement model that understands client requirements and builds data pipelines accordingly. In practice, that suggests FrogData’s team works with the dealership’s IT or DMS provider to set up feeds, ensuring compatibility. In short, if a dealership has diverse and large data sources, FrogData is equipped to integrate all of them and keep them in sync.
- NCM Axcessa: Axcessa was created to be a “single DMS reporting solution”, which underscores its tight DMS integration. It “integrate[s] seamlessly with your DMS” – in fact, NCM has built Axcessa connectors for all major dealership management systems. The data flow is quite frequent (eight updates per day from the DMS, as noted), so while not exactly real-time, it’s near-real-time for practical purposes. This level of integration ensures that the numbers in Axcessa match what’s in the DMS throughout the day (for example, sales, open repair orders, parts inventory, accounting journal entries, etc.). Axcessa’s seamless DMS link means there is minimal manual data input – dealership staff don’t have to import/export files; everything is automatic and cloud-based once set up. Also, Axcessa pulling data directly enables features like CIT tracking and open RO tracking, which rely on up-to-the-minute DMS data. When it comes to CRM data, Axcessa’s primary focus is on DMS (operational and financial data). However, sources suggest Axcessa can incorporate CRM sales data as well (e.g., leads, appointments) if needed, although that may not be its main use. One unique integration aspect: Axcessa marries the DMS data with NCM’s Benchmark data, which is external to the dealer – NCM supplies industry stats. That integration means Axcessa isn’t just pulling from the dealer’s systems, but also from NCM’s database to provide context. Overall, Axcessa is very DMS-centric in integration, making it a straightforward add-on for any dealer’s core system.
- Reynolds ReverseRisk: ReverseRisk is a Reynolds & Reynolds product, so it’s natively integrated with Reynolds DMS (ERA-IGNITE or POWER systems). If a dealership uses Reynolds as their DMS, ReverseRisk’s integration is essentially built-in: it draws directly from the Reynolds database in real time. This tight integration is a plus for accuracy and reliability – data in ReverseRisk is basically an extension of your DMS data (general ledger, vehicle inventory, repair order data, etc.), just presented in a more user-friendly way. If a dealer group uses mixed DMS platforms (some stores on Reynolds, some on another DMS), ReverseRisk may have limitations – R&R historically focuses on its own ecosystem. However, ReverseRisk originated from an independent company that supported multiple DMS before Reynolds acquired it, so it’s possible ReverseRisk still can integrate with other DMS types to some extent. The key integration advantage is depth: because Reynolds controls the DMS and the reporting tool, they can incorporate data like deal notes, exact accounting figures, and so on, without a hitch. Also, integration with Reynolds CRM and other modules is likely; for example, if using Reynolds Contact Management (CRM), ReverseRisk could potentially include lead response metrics or sold/unsold follow-up data, though the public info focuses more on the DMS side. Additionally, ReverseRisk integration extends to financial statement data, meaning P&L statements flow in for analysis without manual input (useful for those forecast vs. actual comparisons). In summary, ReverseRisk is ideal for Reynolds DMS users who want a plug-and-play advanced reporting tool; compatibility is essentially guaranteed in those environments.
- DealerOps: DealerOps was built to sit on top of existing dealer systems by aggregating their data. It “provides powerful data aggregation and integration tools for your DMS, CRM, and other transaction processing systems” in the dealership. This indicates a broad compatibility: DealerOps can pull from various DMS providers as well as popular CRM systems (e.g., VIN Solutions, Elead, etc.) and possibly other systems like finance/payout tools or inventory management systems. By connecting these, DealerOps gives a unified view, eliminating the silo effect. They also list partners and integration connectors on their site, suggesting a robust API integration layer. For example, they might integrate with accounting systems to get expense data or with OEM databases for incentives – anything that helps present a fuller picture. Because DealerOps is smaller than Reynolds or NCM, they often highlight personalized integration: “connecting the right people with the right data” implies they work closely with a dealer to ensure the data that matters to them (from whichever system) is pulled in. This could mean custom integrations beyond standard DMS/CRM, such as pulling data from a used car pricing tool or a phone call tracking system if the dealership requires it. The cloud-based platform then normalizes this data so that reports can run across systems seamlessly. The bottom line is DealerOps is quite integration-friendly, designed to be the single reporting umbrella over all dealer IT systems.
- MyDealerKPI: DealerKPI doesn’t explicitly list all integrations, but given its feature set, it must plug into the dealership’s DMS as the primary source for sales, service, and financial data. It likely uses secure data extracts or API connections to gather information like deals (for sales and F&I metrics), repair orders (for service KPIs), parts transactions (for inventory metrics), and the general ledger (for financial statement tracking). The mention of things like deal status tracking through funding and parts inventory tracking with one click indicates that DealerKPI is reading directly from the DMS’s accounting and inventory modules in near real-time. For CRM, DealerKPI has a lead management mention (in its data recovery system, oddly), which may imply it can integrate or at least import CRM lead data for certain dashboards (like BDC performance). Additionally, any scheduling or appointment data shown in DealerKPI might come from an integration with the service scheduler or their own scheduling module if provided. DealerKPI’s data security and recovery emphasis suggests they create a replica or warehouse of the dealership’s data in their system – which in turn means a continuous integration pipeline from the DMS (to keep that warehouse up to date). This is good for compatibility because it means after initial setup, the data flows automatically and is safely stored in the cloud for the dashboard to use, even if the DMS experiences issues. While not as expansively advertised as some, DealerKPI’s integration approach is to cover all key operational areas by hooking into the necessary systems, ensuring the dashboard isn’t missing any puzzle pieces.
Bottom Line: All platforms score high on DMS integration, as expected, but there are nuances:
- DDS PULSE is notable for integrating both DMS and CRM data seamlessly and unifying all departmental metrics in one place.
- FrogData is a powerhouse for heterogeneous data environments, able to integrate “from all sources” and deliver a unified analytics lake.
- Axcessa is tightly coupled with DMS data (fast updates from any major DMS) and uniquely blends in industry benchmark data.
- ReverseRisk offers deep, native integration for Reynolds users, making it a natural extension of the DMS with no gaps.
- DealerOps provides flexible integration beyond just DMS/CRM, accommodating whatever systems the dealership uses in its operations.
- DealerKPI covers all core dealer data from the DMS and ensures it’s continuously accessible on the dashboard.
For a dealership executive considering these, DDS PULSE stands out by providing a truly unified data platform – it doesn’t treat CRM, sales, service, etc. as separate silos but blends them into one interface for a cohesive view. This, combined with hassle-free DMS/CRM integration, means leaders using PULSE can trust they’re seeing the full picture at all times, without manual consolidation.
Support and Service
A software platform is only as good as the support and service behind it – especially for busy dealership teams that may not have in-house IT resources. Here’s how the players fare in terms of customer support, training, and ongoing service:
- DDS PULSE (Digital Dealership System): Digital Dealership System prides itself on being a technology partner to dealerships, not just a vendor. Their support and service earn high praise from clients. For instance, a Fixed Operations Director testified, “We couldn’t be more pleased with the service and support we receive from the Digital Dealership System. Their team is quick to make updates and support our systems.”. This reflects a proactive support ethos – if the dealership needs a tweak to a report or encounters an issue, DDS responds swiftly to resolve it. Being a relatively focused company (digital signage and performance systems), DDS likely offers personalized support where you can reach knowledgeable staff (even the developers or company leaders) when needed. They also likely assist with the cultural adoption of PULSE – training staff on how to use the leaderboards and get the most out of the tool, which is crucial for long-term success. Overall, DDS’s supportive approach means dealerships feel they have a partner who is invested in their success, not just a helpdesk.
- FrogData: FrogData has a strong service component, especially given the complexity of what they offer. Their approach with new clients includes consulting to build a “decision inventory” and configure role-based access, followed by tracking usage and enabling adoption, making changes as the business evolves. This suggests a high-touch onboarding and support model – FrogData doesn’t just hand over a tool; they work with the dealership to tailor it and ensure it’s being used effectively. This is further evidenced by customer testimonials. One veteran auto executive said, “I have done business with many vendors… FrogData is one of the best. Their first concern is whether they are getting us the most return for our investment… They achieve awesome results and go out of their way to make it happen!”. Such feedback indicates FrogData’s team actively monitors outcomes and is willing to do extra (even custom work or analyses) to ensure the dealer sees value. In terms of support, they provide both phone support and likely a dedicated account manager who understands the dealer’s data environment. They also continually update the platform (as a SaaS) so part of support is delivering new features and improvements regularly. All told, FrogData offers enterprise-grade support with a consultative touch, which can be reassuring for dealerships embarking on advanced analytics.
- NCM Axcessa: NCM Associates, known for training and consulting (like 20 Groups and in-dealership training), extends that culture of support to Axcessa users. Axcessa subscribers not only get the software but also access to NCM’s expertise. This might include help in interpreting the reports and benchmarks, or guidance on setting up the dashboards for your specific strategy. While the website’s support section simply offers “Request Support Help”, NCM’s broader organization likely provides customer success representatives or even consultants who can advise on improving metrics seen in Axcessa. In fact, NCM’s positioning of Axcessa is that it empowers the management team to focus on people and improvement – something that ties into their training philosophy. It wouldn’t be surprising if Axcessa customers are invited to NCM webinars or workshops on dealership analytics best practices. Essentially, support for Axcessa is backed by NCM’s decades of industry knowledge, which means issues are resolved by people who understand dealership operations deeply. Additionally, Axcessa being widely used means a community of dealers exists who share best practices (especially in 20 Group meetings). On the technical side, as a mature product, Axcessa has a stable support system for any technical difficulties, and NCM ensures compatibility when DMS providers update their systems, etc. Dealership leaders can trust that Axcessa support is just a call away – and that they’re talking to someone who speaks the language of automotive retail.
- Reynolds ReverseRisk: Being part of Reynolds & Reynolds, ReverseRisk comes with the heft of a large organization’s support infrastructure. Reynolds offers formal Customer Success Services and training programs for all its solutions, and ReverseRisk is likely included in that. They have a Technical Assistance Center and support lines that are well-established. Unique to Reynolds, they often include on-site training or virtual training sessions whenever a new product is implemented. According to a Reynolds guide, “They will train your team, while working with management, to result in lasting and impactful change driven by ReverseRisk data.”. This indicates that when ReverseRisk is rolled out, Reynolds doesn’t just switch it on – they actively help dealerships learn how to use the reports to drive process changes and improvements. That level of consultative support is crucial; it helps in user adoption and ensures the tool genuinely benefits the business. Ongoing, Reynolds’ support likely includes regular updates (especially if linked to DMS changes), and a dedicated account manager who reviews your usage of ReverseRisk (maybe showing you new features or reports that you haven’t been using yet). The only caveat is Reynolds is a large company, so support is structured (ticket systems, call centers). Some dealers appreciate that formality; others might prefer a more boutique support experience. Nonetheless, for a dealership, the safety net of Reynolds’ extensive support team and resources is a big plus – you know the tool will be maintained and your staff will have training materials and help available.
- DealerOps: DealerOps, being a smaller specialized company, likely offers very personalized support. Often, their CEO or senior team might directly get involved in onboarding new clients (as is common with smaller SaaS providers in automotive). They emphasize “client success” on LinkedIn and likely via their site (mention of a Client Success Manager in staff). This means dealerships get a dedicated point of contact who understands their setup. DealerOps also probably provides custom solutions as part of support – e.g., if a dealer needs a new report or a tweak to a metric formula, DealerOps can often implement that quickly. Their support likely includes initial training sessions (remote or on-site) to ensure management knows how to use all the features. Additionally, because DealerOps is newer, they may be very receptive to feedback – if a dealer requests a feature that could benefit many, DealerOps might add it in future updates (essentially co-developing with their clients). On the technical support front, as a cloud service, they handle all the data updates and server maintenance; the dealer doesn’t need to worry about anything except using the front-end. Any issues connecting to a DMS or CRM, DealerOps handles by liaising with those vendors. In summary, DealerOps offers nimble, attentive support – the kind of hands-on help that can adapt to each dealership’s needs. This is attractive to dealership leaders who want a more boutique service experience where they feel like a valued partner, not just a number.
- MyDealerKPI: DealerKPI’s support is likely characterized by the fact that it’s built by a dealership person – they understand the urgency when something’s not right. While details aren’t publicly given, we can infer that as a smaller operation, DealerKPI offers direct support lines (probably you can get someone on the phone quickly). Their emphasis on data security and reliability also suggests they take a proactive approach – ensuring backups and uptime so that dealers rarely have to call in the first place. If a dealership were to have an issue (say a data feed stopped or a metric looks off), DealerKPI’s team would jump on it because their reputation rides on being a “game-changer” that’s hassle-free. Since they also have modules like scheduling and others, they’d support those operationally (for example, helping set up the scheduler with your service hours, etc.). In addition, because MyDealerKPI covers various departments, they might offer department-specific training – teaching service managers how to use the service dashboard, sales managers how to leverage the sales log feature, and so on. The fact that it’s an all-in-one tool means their support has to be well-rounded across dealership functions. In essence, DealerKPI offers friendly, knowledgeable support that comes from “speaking dealership” natively. Dealership leadership can expect a more informal but effective support relationship – possibly even dealing with the founder or original developers for high-level concerns.
Bottom Line: When it comes to support and service, all these platforms come with strong backing, but in different flavors:
- DDS PULSE and DealerOps give a high-touch, partner-like support experience – quick responses, personalized help, and a willingness to adapt to dealer needs.
- FrogData provides an ROI-focused, consultative support, ensuring the dealer actually realizes value and not hesitating to put in extra work to achieve results.
- Axcessa (NCM) offers industry-informed support, leveraging NCM’s training mindset – a blend of technical help and performance coaching for management teams (so they can act on what the reports show).
- ReverseRisk (Reynolds) has comprehensive corporate support and training programs, meaning dealerships get thoroughly trained and have a big support organization to lean on.
- DealerKPI likely provides friendly, founder-led support that is practical and understanding of dealership day-to-day realities.
For many dealership leaders, support is a major deciding factor. DDS PULSE’s clients routinely commend its support quality, which speaks volumes. Knowing that PULSE’s team is “quick to make updates” and intimately involved in client success can give confidence that adopting PULSE is not just buying software – it’s gaining a committed support partner for the long haul.
Unique Selling Points and Differentiators
Each platform has standout features or philosophies that set it apart from the rest. Understanding these unique selling points helps clarify which solution might best fit a dealership’s specific goals or challenges. Here’s a look at what’s special about each – and how DDS PULSE shines in comparison:
- DDS PULSE: The uniqueness of PULSE lies in its real-time, staff-facing performance culture. Unlike traditional reporting tools that are manager-oriented, PULSE brings data to the forefront of daily operations. By displaying live leaderboards on TVs and devices, it introduces a friendly competition and transparency among the team that others don’t inherently provide. PULSE is effectively “moderniz[ing] the dry-erase board” with a digital, automated solution. This means salespeople, service advisors, etc., always know where they stand and are motivated to hit goals in the moment – a powerful behavioral motivator that goes beyond passive reporting. Another huge differentiator is PULSE AI. PULSE is ahead of the curve by integrating an AI assistant (developed with Meta’s technology) that allows users to simply ask questions of their data and get answers instantly. For example, a general manager could ask, “Which salesperson had the highest gross per unit last month?” and PULSE AI could retrieve that insight without the manager digging through reports. This natural language querying is cutting-edge in dealership software – none of the other platforms have openly advertised a similar feature to date. Furthermore, PULSE’s unified data interface across all departments (sales, fixed ops, BDC) is a unique approach in tying every part of the dealership together. It fosters a one-team mindset and makes cross-departmental strategy easier (for instance, seeing how sales and service together are contributing to total gross). Lastly, DDS PULSE is part of a broader Digital Dealership System ecosystem (digital signage, showroom media, etc.), so it can leverage synergies – for example, displaying leaderboard highlights on showroom screens that customers see, or integrating with service lane displays to show advisor rankings. This convergence of customer experience tech and backend analytics is something only DDS offers. In sum, PULSE’s unique value is energizing dealership performance management with real-time visibility, innovative AI, and comprehensive integration, thereby actively driving profit and accountability in ways competitors mostly measure passively.
- FrogData: FrogData’s key differentiator is its advanced analytics and AI capability. It’s not just a KPI tracker; it’s a full-blown decision analytics platform that can perform predictive modeling and support complex decision-making scenarios. For dealerships (especially larger groups) that want to go beyond what happened and into “what will happen” or “what should we do,” FrogData is unique. It employs machine learning to find patterns (for example, identifying what factors most impact service profitability, or forecasting future sales based on multiple data points). FrogData essentially brings a data science approach to a dealership – something that would otherwise require hiring analysts or data engineers. Another unique aspect is FrogData’s breadth of solutions: it offers modules like FrogBI (business intelligence) for unlimited data exploration, FixedOps-specific tools like Mojo for service management, FrogAI for marketing and sales decisions, and even a WarrantyBoost AI that helps increase manufacturer warranty reimbursement rates. No other platform in this comparison has such a wide array of specialized AI-driven tools. Additionally, FrogData’s ethos of continuous improvement (they will adapt the system to the dealer’s evolving needs and track usage) means the platform grows with you – a unique service proposition. For a dealer group wanting to harness big data (including external data like market trends, OEM data, etc.), FrogData stands out as the platform that can unify dealership data + data science to yield strategic insights beyond the obvious.
- NCM Axcessa: Axcessa’s standout feature is its benchmarking and dealer-designed content. By incorporating NCM Benchmark data, Axcessa doesn’t just show your performance – it constantly shows where you should or could be, based on top performers. This context is golden for dealership leaders; it transforms reporting into a coaching tool. For example, seeing that your expense ratio is above the NCM Benchmark can prompt immediate corrective actions. Axcessa is also unique in that it was born out of dealership consulting – it embodies decades of NCM’s knowledge of what metrics drive success. The interface literally has reports named in dealership lingo (CIT, open ROs, etc.) that mirror the standard 20 Group composite categories. That familiarity is a selling point: it feels “by dealers, for dealers.” Another differentiator is simplicity at scale – having “hundreds of preformatted reports” is a treasure trove for any question you might ask. Chances are, if a general manager or department head wonders about something, Axcessa already has a report for it (or something close). Also, Axcessa’s focus on freeing managers from manual reporting (an oft-cited pain point) and letting them focus on their people is a cultural advantage. It subtly positions itself not just as software, but as a management philosophy enabler – NCM’s philosophy of managing by the numbers and coaching people. In a market where many tools feel tech-first, Axcessa feels management-first, which is uniquely appealing to a lot of seasoned automotive leaders.
- Reynolds ReverseRisk: ReverseRisk’s unique strength is being embedded in the Reynolds ecosystem and laser-focused on financial performance management. It’s not an external bolt-on; for Reynolds DMS users, it’s almost an extension of their core system. This yields some unique capabilities: for example, ReverseRisk can tap into Reynolds-specific data nuances, such as deal jacket notes, or utilize R&R’s docuPAD or accounting data in ways third-party tools might not. Another differentiator is the enterprise comparison ability, which some others have but ReverseRisk emphasizes in its marketing – the ability to “compare your store’s performance amongst themselves” easily for groups. That is a key selling point for dealer groups who want an integrated solution. ReverseRisk also uniquely highlights cash flow management aspects, like identifying which F&I managers aren’t using the fastest funding banks, or highlighting aged contracts to speed up funding. Those are very specific, actionable insights tailored to dealership operations that few generic BI tools would catch. Additionally, the forecasting function (Actual vs Forecast) is somewhat unique; while others allow trending, ReverseRisk explicitly helps you project where you’ll end up, which for a lot of dealerships is crucial for month-end steering. And of course, being from Reynolds, a selling point is one-stop support and integration – a Reynolds DMS store can implement ReverseRisk knowing it will work smoothly with all their existing R&R modules and that they have one accountable provider. In essence, ReverseRisk’s value prop is better dealership reporting the “Reynolds way” – deep integration, financial insight, and enterprise control.
- DealerOps: DealerOps differentiates itself on customization and speed. It’s not a one-size-fits-all product; indeed, they state “we don’t believe in one-size-fits-all” as a mantra. Every dealership is a bit different in process and focus, and DealerOps appears to embrace that by offering custom-tailored reporting solutions and the ability to build bespoke reports easily. If a dealership has a unique KPI or a specific format for composite reports, DealerOps can accommodate it without forcing a square peg in a round hole. This flexibility is a major selling point for analytical dealerships or groups that have outgrown cookie-cutter solutions. Additionally, DealerOps touts being “the most precise” reporting solution and delivering results in seconds. That emphasis on precision suggests high data accuracy (no rounding errors or sync issues) and on speed suggests that management can rely on getting info right when they need it (no overnight waits). DealerOps also mentions specialties like Forensic Reporting and Virtual 20 Groups. “Forensic reporting” likely means the ability to audit and trace data (e.g., identify discrepancies or find the root cause of an accounting mismatch). That’s a unique twist – not just reporting performance, but ensuring data integrity and catching anomalies (perhaps even fraud detection or process breakdowns). “Virtual 20 Groups” hints that the software can simulate the comparative analysis one would get in a dealer 20 Group, possibly by comparing stores or time periods in a similar fashion. This is a clever unique feature targeting groups who want internal benchmarking. In summary, DealerOps’ unique proposition is ultimate flexibility and specialized analytical tools, which can be extremely attractive to dealers who feel constrained by more rigid platforms.
- MyDealerKPI: DealerKPI’s uniqueness comes from being an all-in-one operational tool beyond just KPI tracking. It’s not common for a performance platform to also include functional modules like an Appointment Scheduler to increase service bookings or direct integration to manage parts inventory in real time. By offering these, DealerKPI blurs the line between analysis and operation – managers can not only see metrics but also take action in the same system (e.g., schedule more appointments to fix a slow day in service). This can streamline workflows significantly. Also, DealerKPI’s creation story (“developed by a dealer”) is a unique selling narrative – it tends to resonate with dealers who might distrust software that feels like it’s made by tech folks with no dealership experience. This origin means the platform often covers “little things” that matter day-to-day. For example, tracking deal status through every stage (delivered, not delivered, funded, RDR, etc.) in the Sales Log is a very dealership-centric detail that not all platforms include, but it’s hugely important to sales managers. DealerKPI is also very immediate – its promise of answers “with a click” and critical info on one screen is a selling point to very busy dealers who want to minimize time spent hunting data. Lastly, the focus on continuous data availability and disaster recovery is a unique angle: it reassures dealers that their data and reports are always accessible, even if something happens to their local systems. That level of reliability is often taken for granted, but making it a feature suggests DealerKPI’s intended customers are those who can’t afford any downtime or data loss in their reporting (which is essentially everyone, but highlighting it sets them apart). In essence, DealerKPI’s niche is combining insight with action in a very dealer-friendly package.
Bottom Line: Each competitor brings something unique:
- FrogData brings data science and AI muscle,
- Axcessa brings benchmark-driven simplicity,
- ReverseRisk brings deep integration and profit focus,
- DealerOps brings customizable, high-speed analytics,
- DealerKPI brings operational integration and dealer-built practicality.
DDS PULSE, however, combines several unique strengths into one platform. It merges the motivational, real-time team engagement (unique to its leaderboard approach) with robust cross-department analytics and now AI-powered querying, which is at the forefront of innovation. PULSE’s unique ability to not just report but also instill an accountability culture and competitive drive in the dealership sets it apart in a very meaningful way – it doesn’t just inform leadership, it actively influences the behavior of every employee toward better performance. For dealership leaders looking for a solution that energizes their organization, not just monitors it, DDS PULSE clearly delivers exceptional value.
Why Dealerships Choose DDS PULSE
In a crowded field of dealership analytics platforms, Digital Dealership System’s PULSE emerges as a leader by excelling across all the factors that matter – and doing so in a way that tangibly improves dealership performance. Here’s why more and more dealership leadership teams are choosing DDS PULSE:
- Unified, Real-Time Insights That Drive Action: PULSE offers a unified data platform that consolidates sales, service, and BDC metrics into a single, live interface. Dealership principals and managers get one truth for the whole operation. Because the data refreshes automatically and frequently, decisions are based on what’s happening right now – not last week or last month. This real-time element means leaders can identify issues and opportunities early and act on them immediately. Competitors provide data, but PULSE ensures that data is always current and readily visible to the people who need it most.
- Exceptional Ease of Use and Team Engagement: The user-friendly interface and visually engaging dashboards make PULSE remarkably easy to use for all levels of staff. More importantly, by putting live KPIs on the wall (literally, via TVs), PULSE gets the entire team engaged with the numbers. It’s a solution that not only informs management but also motivates front-line employees – a rare combination. As a result, dealerships see improved accountability and enthusiasm: staff know their standings on the leaderboard and strive to hit targets in a healthy competitive spirit. Whereas other systems might require managers to pull reports, PULSE broadcasts performance automatically, creating a culture where everyone is focused on winning. This leads to increased productivity and profits, as one PULSE display can inspire an extra sale or an upsell that otherwise might have been missed.
- Scalability and Enterprise Strength: Whether you run a single store or a large dealer group, PULSE scales effortlessly to your needs. Its enterprise features allow regional and group-level reporting, while maintaining simplicity at the store level. A CEO overseeing 10 dealerships can quickly compare store KPIs, while a sales manager at one store can drill into their team’s numbers – all within the same system. PULSE’s cloud-based architecture and secure multi-store access mean no complex IT overhead as you grow. This flexibility to start small and go big gives owners confidence that PULSE is a long-term solution.
- Seamless Integration and Data Accuracy: Dealerships choose PULSE because it “plays well with others.” It integrates seamlessly with all major DMS and CRM systems, pulling data directly without manual work. The data is accurate and trustworthy – what you see on the PULSE dashboard matches what’s in your DMS, down to the deal or RO, because PULSE updates continuously from the source. This reliability frees managers from second-guessing the numbers and from tedious report reconciliation. Moreover, PULSE’s ability to combine data from multiple sources (sales, customer leads, service shop) into one view offers insights that segmented tools can’t – for example, linking how increased service appointments (BDC data) drive higher parts sales (DMS data) in one report. Data-driven decision making becomes intuitive with PULSE, as all the relevant info is already connected for you.
- Innovative AI Capabilities: With the introduction of PULSE AI, DDS has leaped ahead in making advanced analytics accessible. Dealership leaders are increasingly tech-savvy and want the ability to query data in natural language. PULSE delivers this futuristic capability today – you can simply ask, “What was our gross profit per new unit last week compared to the same week last year?” and get an answer instantly, without poring over spreadsheets. This innovation saves time for busy executives and opens up analytical exploration to those who might not be adept at traditional BI tools. It’s like having a smart analyst on call 24/7 within the platform. None of the competing platforms offer such a feature integrated so seamlessly. Forward-thinking dealerships choose PULSE because they recognize that this kind of AI-driven insight is the future of dealership management, and PULSE is already delivering it.
6. Superior Support and Partnership: Finally, dealerships choose DDS PULSE because of the company behind it. Digital Dealership System has proven to be a responsive, dealership-focused partner. Clients routinely praise the quick support and proactive service – for instance, getting updates or custom tweaks turned around rapidly to meet the store’s needs. This level of support means that adopting PULSE is smooth and maintaining it is worry-free. Training the team is straightforward with DDS’s help, and user adoption runs high because the DDS team ensures PULSE aligns with the dealership’s processes. In an industry where time is money, having a supportive vendor is invaluable. DDS’s dedication to client success – demonstrated by how fast dealerships see ROI (some note the system “paid for itself within weeks” through improved results) – gives decision-makers peace of mind.
Conclusion
While FrogData, Axcessa, ReverseRisk, DealerOps, and DealerKPI each offer compelling features, DDS PULSE delivers a balanced, high-impact combination of capabilities that truly elevates dealership performance management. It merges real-time data with real-world dealership dynamics, providing not just reports, but a platform that fuels better decisions and better results. Dealerships choose DDS PULSE because it’s more than software – it’s a catalyst for a data-driven, accountable, and ultimately more profitable dealership culture. With PULSE in place, leaders can confidently steer their dealerships knowing that every metric, every trend, and every opportunity is visible, understandable, and within reach of the team that can act on it – and that makes all the difference.
There’s a Reason Why Digital Dealership Systems is the #1 Choice for Top Car Dealerships:
Staff-Facing TVs rotate with live reports to track and motivate staff throughout the day instead of waiting for meetings or printed reports.
Mobile alerts and reports give staff and managers updated information including pace, goals, and sales history while away from their desk.

Simple desktop reporting and closeout reports allows managers to focus on today’s tasks and not building and analyzing reports based on past performance.
AI Overviews, Interactive reports, performance evaluations and coaching allow managers to boost sales and motivate teams without being bogged down by reports and analytics.