Fixed ops performance changes every hour of the day.
Advisor numbers change. Technician hours change. OP code progress changes. Percent-to-goal changes. By the time a report is pulled, shared, or discussed, those numbers are already outdated.
The Fixed Ops Director of Jeff Haas Mazda, Keith Cline, explained it well. By the time he shares reports with his team, their day has already started — and key details like percent-to-goal, OP Code Tracker, and other performance numbers have already changed.
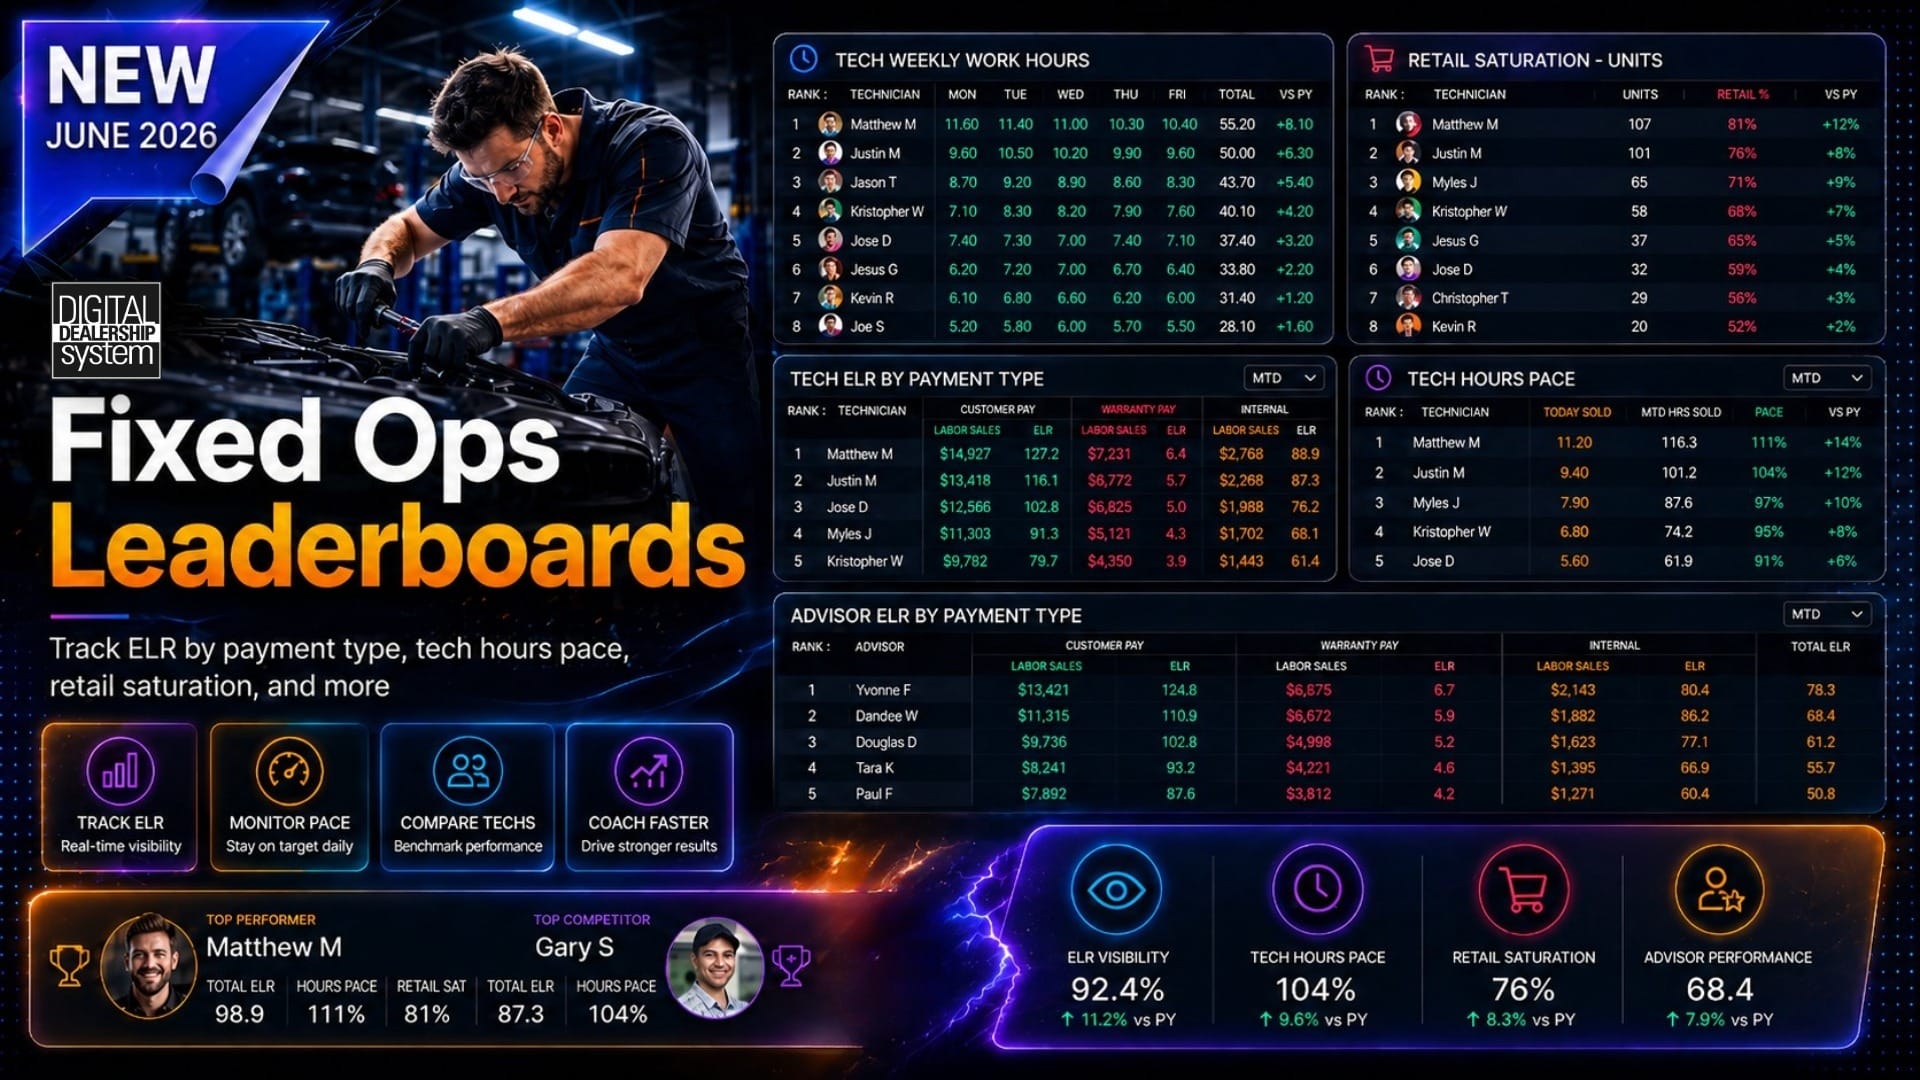
The solution is DMS-connected, real-time leaderboards.
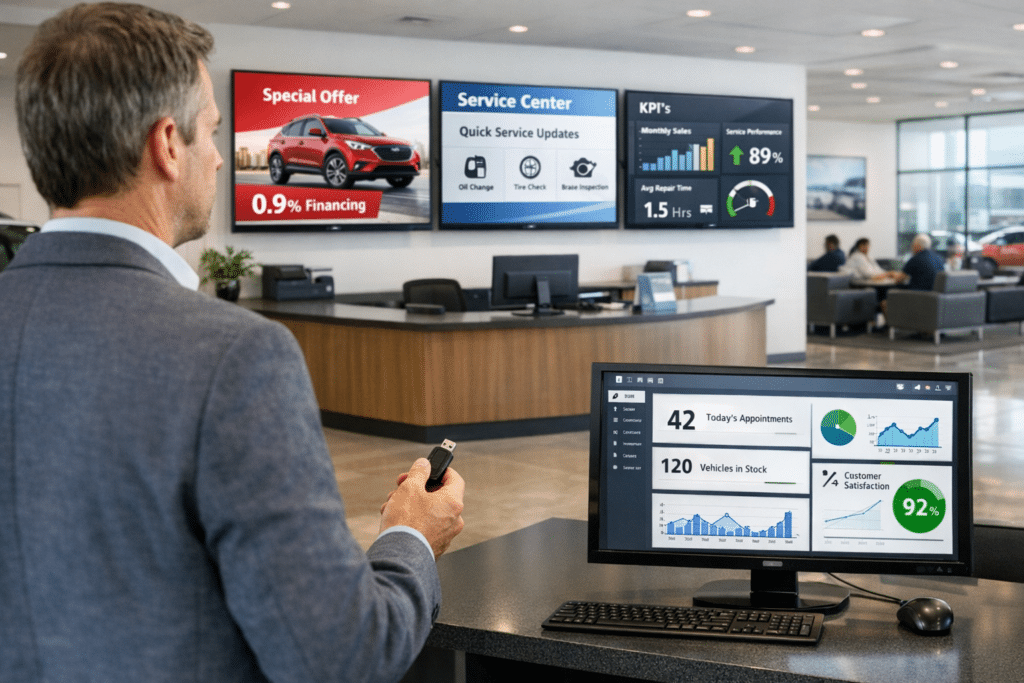
The newly added set of fixed ops leaderboards helps managers keep performance visible while there is still time to coach, adjust, recognize wins, and improve the day.
5 Key Takeaways
Leaderboards make performance visible throughout the day
Managers and team members can see where they stand before the end of the day.
Live data helps managers coach sooner.
Instead of waiting for end-of-day reports, managers can act while performance can still be improved to make the most of each day
ELR by Payment Type gives leaders better detail.
Managers can see how advisor and technician performance changes across customer pay, warranty, and internal work.
OP Code Goals keep the team focused.
Managers can track key service categories like alignments, tires, brakes, batteries, flushes, MPI, and more.
Tech hours reports help managers understand productivity.
Leaders can review technician pace, weekly work hours, and performance movement with clearer context.
Managers Need Performance Data the Team Can Actually See
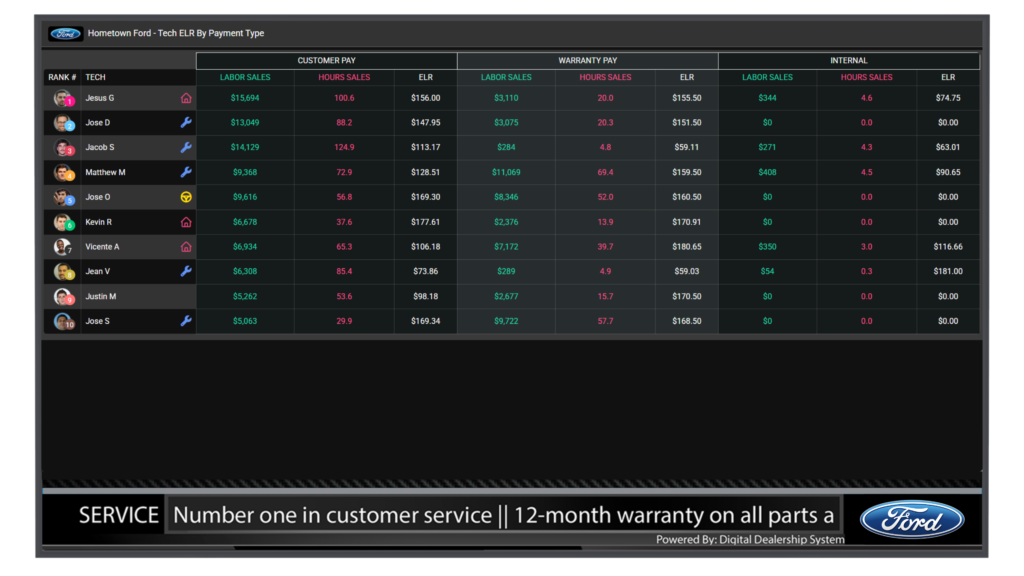
Most fixed ops managers already track the numbers that matter: hours sold, labor sales, effective labor rate, RO count, OP codes, advisor performance, technician productivity, and goal progress.
But reports only help so much if the team can only see them at a consistent delay.
A report sitting on a manager’s desk may help leadership review performance. But it does not always help an advisor or technician adjust to improve performance before the month’s end.
Leaderboards help close that gap.
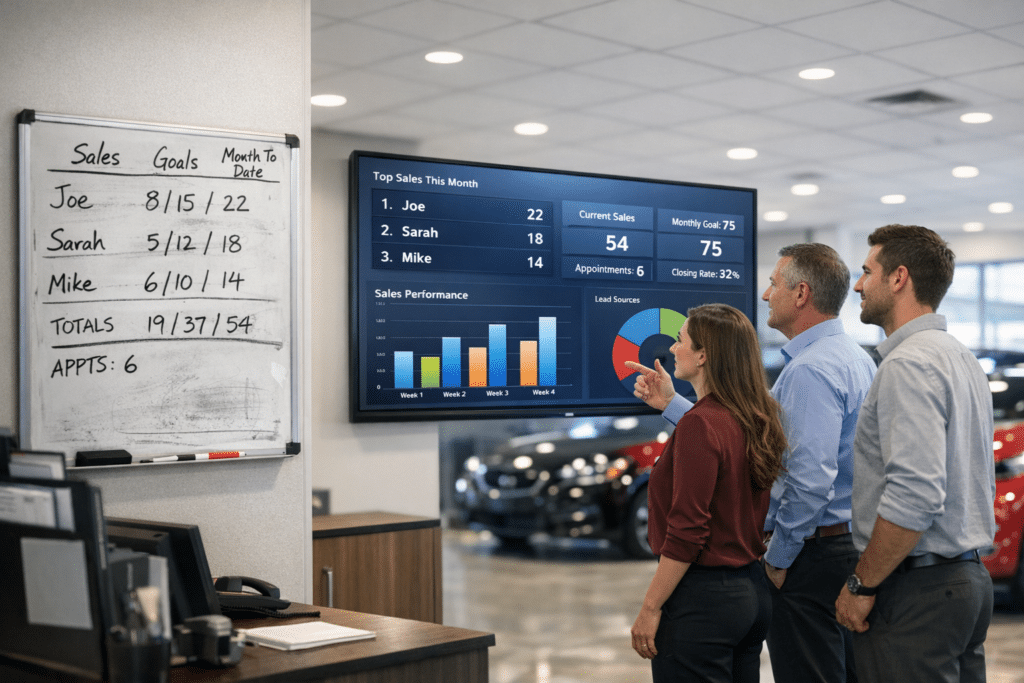
They give the team a shared view of performance. Advisors can see where they stand. Technicians can see how they are pacing. Managers can see who may need coaching and who deserves recognition.
This makes reporting more useful.
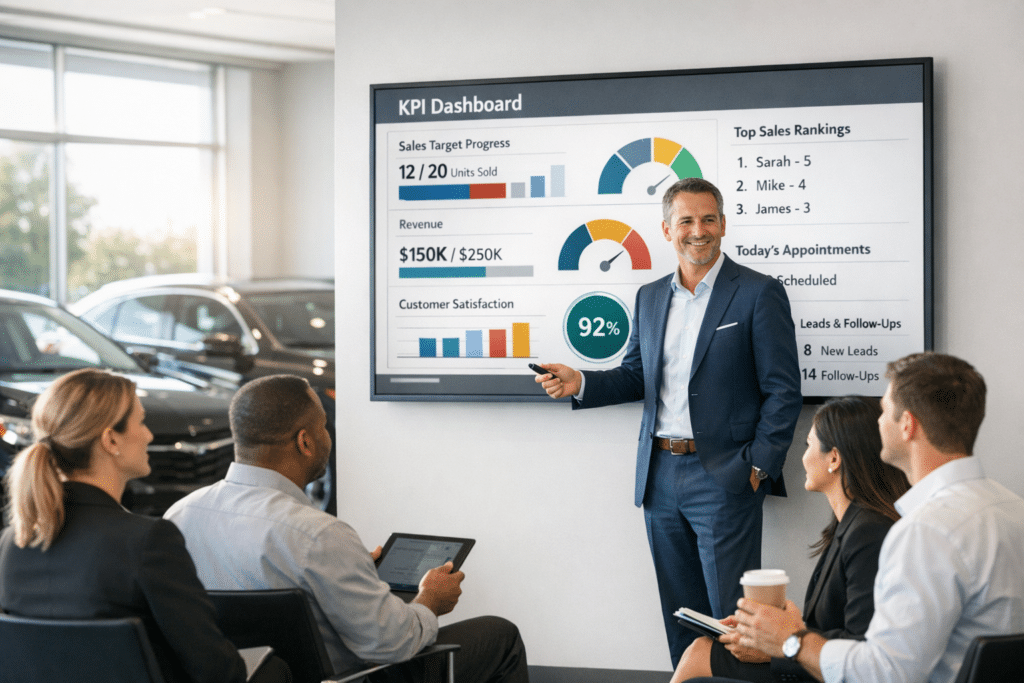
Instead of only reviewing what happened after the day is over, managers can use live performance data to lead the team while the day is still in motion.
ELR by Payment Type Shows Where Performance Is Really Coming From
Total numbers are helpful, but they do not always tell the full story.
An advisor may look strong overall, but their results may be different across customer pay, warranty, and internal work. A technician may have solid total hours, but the type of work behind those hours may matter.
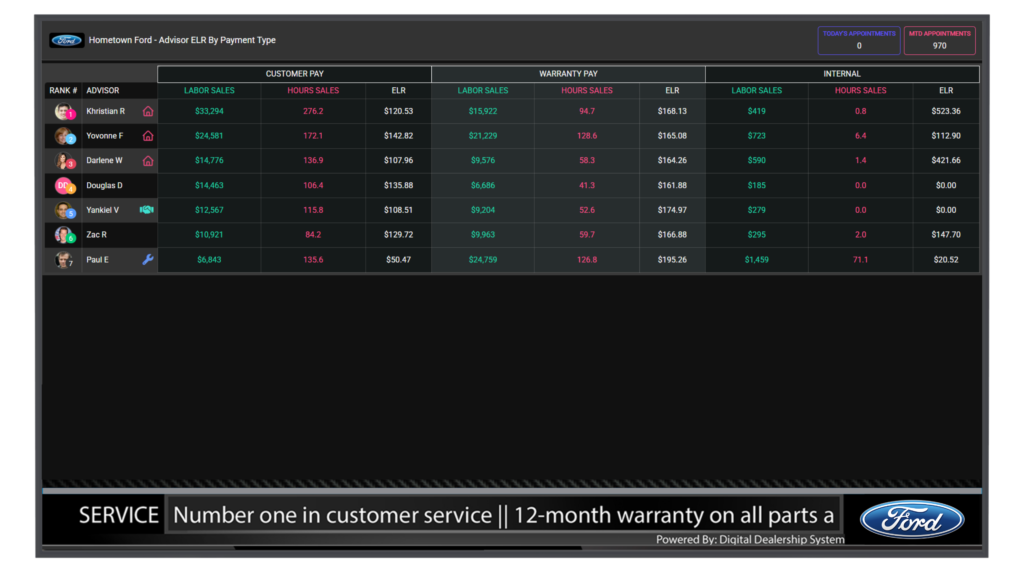
That is the value of the ELR by Payment Type leaderboard.
For advisors, this report helps managers review labor sales, hours sold, and effective labor rate across payment types.
For technicians, it gives shop leaders a clearer view of how different types of work affect hours, labor sales, and effective labor rate.
This helps managers coach with more detail.
Instead of relying on one broad total, leaders can see where performance is coming from. They can ask better questions, spot promising opportunities, and have more effective conversations with the team.
The management benefit is simple: better detail leads to better coaching.
OP Code Goals Keep the Team Focused on Key Service Opportunities
Every service department has categories that matter.
For some stores, it may be alignments. For others, it may be tires, brakes, batteries, flushes, MPI, windshields, or other tracked services.
The challenge is keeping those categories visible during the day.
If managers only review OP code performance after the day is over, they can see what was missed. But they have less time to change the outcome.
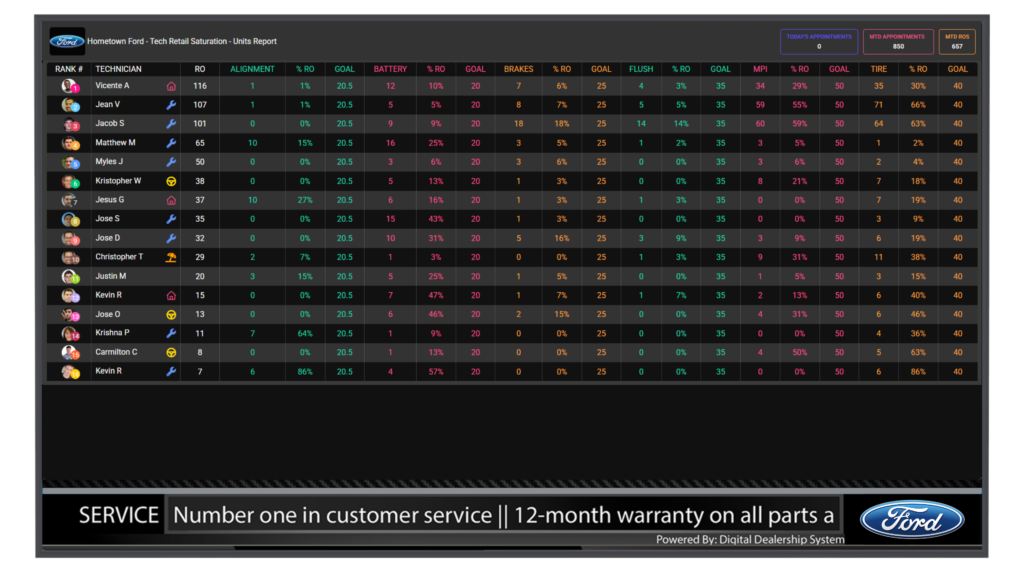
Fixed Ops OP Code Goals help managers track performance against selected service categories while the day is still active.
If alignments are behind goal, managers can bring attention to it. If tire opportunities are moving well, they can recognize that performance. If MPI numbers are low, they can review the process and refocus the team.
This helps managers move from “Here is what happened” to “Here is where we need to focus right now.”
A leaderboard to display OP code goals is not just about tracking codes. They help managers keep the team focused on the services that drive performance.
Tech Hours Reports Help Managers Track Productivity and Pace
Technician productivity is one of the most important areas of fixed operations.
Managers need to know how many hours are being produced, how technicians are pacing, and whether current performance lines up with recent history.
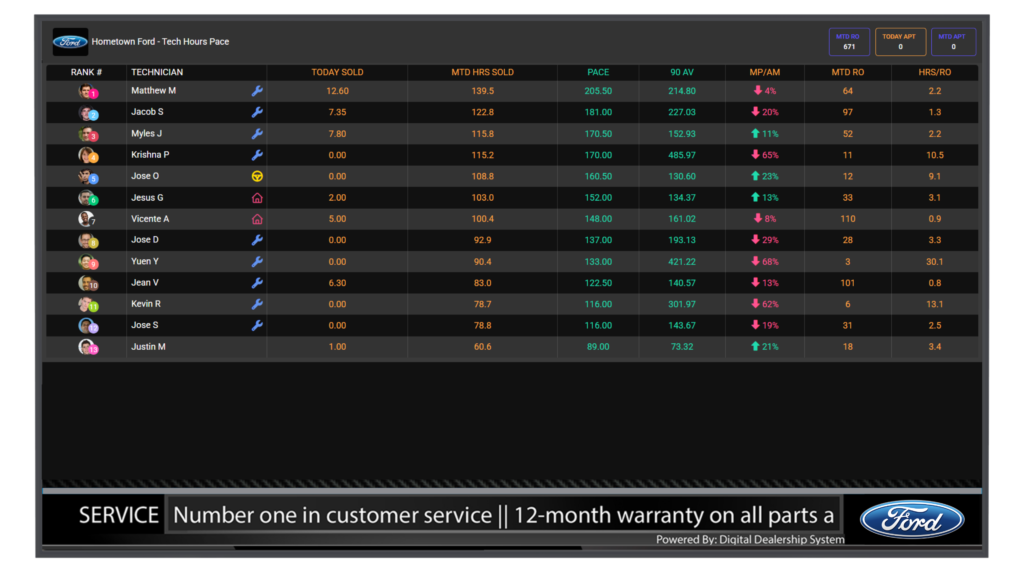
The Tech Hours Pace leaderboard helps managers compare each technician’s current hours pace against their recent average.
Month-to-date totals alone do not always tell the full story. A technician may look strong in total hours but still be pacing below their normal average. Another technician may not have the highest total yet, but may be trending above their recent pace.
That context helps managers coach more fairly.
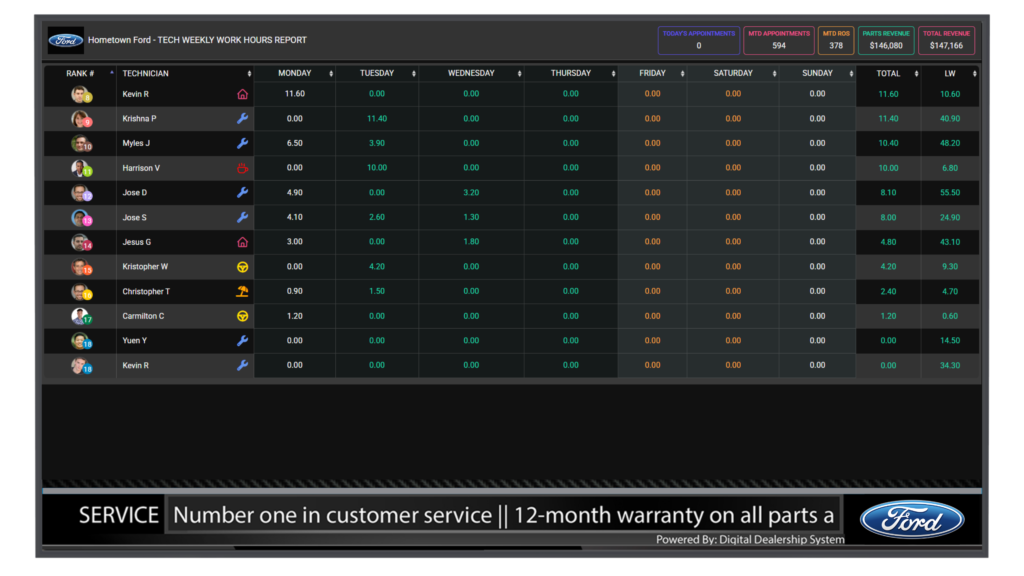
The Tech Weekly Work Hours leaderboard adds another layer of visibility. It shows daily technician work hours, weekly total hours, and comparison to last week.
This can help managers spot workload patterns, productivity changes, and possible issues with scheduling, dispatch, or shop flow.
These new leaderboards provide a clearer view of how technician productivity is moving, not just where it ended.
Live Leaderboards Create Accountability While There Is Still Time to Improve
The biggest benefit of fixed ops leaderboards is timing.
If the team only sees the numbers after the day is over, the report becomes a recap. It may explain what happened, but it cannot help change the outcome.
Live leaderboards give managers a better chance to influence the day while it is still happening.
They can coach advisors who are falling behind. They can review technician pace. They can bring attention to OP code goals. They can recognize strong performers. They can spark friendly competition. They can remind the team what success looks like before the opportunity is gone.
That kind of visibility creates stronger accountability and a more profitable service department.
Goals are no longer hidden in a spreadsheet or discussed only in meetings. They are visible, current, and easier to understand.
For dealership management, that is the real value.
Schedule a demo to see how Digital Dealership System helps fixed ops managers avoid missed opportunities and turn real-time performance visibility into better coaching, accountability, and results.