You can boost service revenue by turning wait time into sales with digital service‑drive signs that cut perceived waits by up to 33% and raise satisfaction by 46%. Show transparent, real‑time pricing and package comparisons to lift conversions 20–30% and reduce disputes. Use status boards to lower front‑desk interruptions and targeted CMS/CRM promos to increase upsell participation and incremental gross profit. Track uplift, payback period, and repeat visits to prove ROI — keep going to see implementation and metrics.
Key Takeaways
- Real-time status boards reduce perceived wait times and front-desk interruptions, improving throughput and customer satisfaction.
- Transparent, up-to-date pricing displays increase service conversions and reduce negotiation friction.
- Interactive package comparisons showcase upgrade value, boosting upsell conversion and average ticket size.
- Targeted promotions and dynamic visuals drive engagement, higher participation in add-ons, and repeat visits.
- Centralized CMS and analytics enable rapid rollout, trackable ROI, and scalable revenue growth across locations.
How Service‑Drive Signs Directly Lift Service Revenue
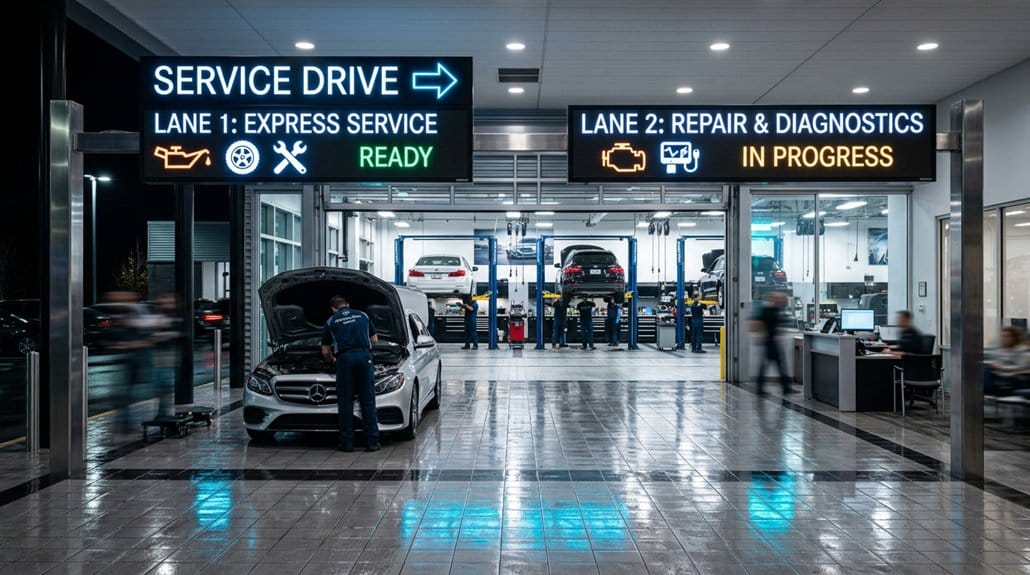
One clear way digital service‑drive signs lift your service revenue is by cutting perceived wait times—by as much as 33%—which boosts satisfaction and repeat visits; add engaging promotional content and real‑time service‑status updates, and you get higher participation in upsells and a 46% jump in customer satisfaction, translating directly into more retained service business and incremental spend during visits. You’ll convert waiting time into revenue with targeted promotions and stage‑progress updates that increase upsell take rates. Streamlined check‑in via signage reduces friction, freeing techs to deliver faster throughput and higher repair capacity. That operational gain improves labor productivity and service bay utilization, boosting margins. Embracing customer engagement and digital innovation delivers measurable ROI through higher retention, per‑visit spend, and throughput.
Transparent Service Menus and Upfront Pricing That Boost Conversions
Show clear service price lists and side-by-side package comparisons on your service-drive signs to remove friction and build trust instantly. Studies show upfront pricing can boost service conversions by up to 30% and, when tied to real-time DMS data, cut perceived wait times and lift satisfaction by as much as 46%. That transparency also creates measurable upsell opportunities—highlighting promos and package differentials drives higher average ticket value and faster booking decisions.
Clear Service Price Lists
Transparency pays: displaying clear service price lists on your digital signs removes guesswork, cuts miscommunication, and can lift service conversions by up to 30%. You’ll deliver pricing transparency and customer empowerment by showing standardized fees for common services, reducing negotiation friction and making decisions faster. Real-time updates let you push promotional rates or reflect parts-cost changes immediately, protecting margins while keeping customers informed. Clear menus set realistic expectations, lowering dispute rates and boosting repeat business—both measurable ROI levers. Research also shows visible pricing shortens perceived wait times, improving throughput and technician utilization. Implement concise, scannable price lists optimized for legibility and mobile recall; track conversion lift, average repair order, and customer satisfaction to quantify impact and justify digital-sign investment.
Visible Package Comparisons
After listing clear prices, you can push the impact further by displaying side-by-side service package comparisons that make trade-offs and value obvious at a glance. You’ll increase customer engagement by showing tiered options, clear inclusions, and incremental benefits, which research links to up to a 20% rise in conversion from transparent pricing. Presenting upgrade paths visually drives service differentiation, nudging customers toward higher-value tiers while maintaining trust. Combine these comparisons with real-time status updates to cut perceived wait times by as much as 33%, keeping prospects receptive to upsells. Data shows engaging comparison content can boost interaction rates by ~48%, translating to measurable retention and revenue gains. This approach delivers clear ROI through higher conversion and average transaction value.
Real‑Time Status Boards: Cut Interruptions and Speed Throughput
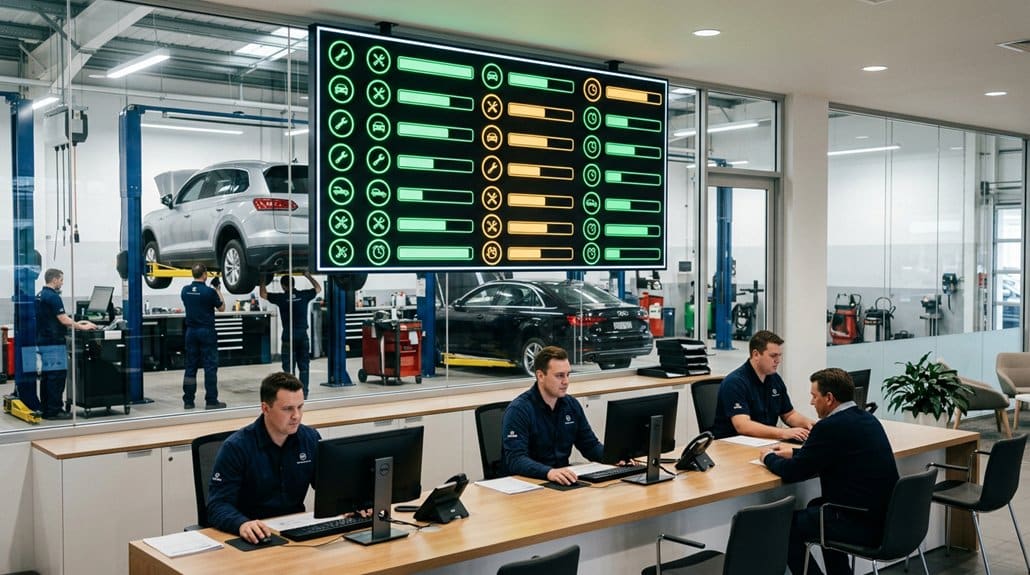
When customers can see real-time status boards showing each service stage and estimated completion times, your front desk gets fewer interruptions and technicians stay focused—studies show dynamic displays can cut perceived wait times by up to 33%, which directly improves throughput and customer satisfaction. You’ll boost customer engagement and service transparency while freeing staff for revenue-generating tasks. Real-time updates set expectations, build trust, and uncover upsell opportunities without extra labor.
| Metric | Impact |
|---|---|
| Perceived wait time | -33% |
| Front-desk interruptions | -x% (case-dependent) |
| Technician focus | +y% (efficiency gain) |
| Revenue per visit | +z% (upsell potential) |
Measure installation cost against reduced labor touches and increased add-ons to calculate ROI.
Lounge Content That Reduces Perceived Wait Times and Drives Add‑Ons
Make your service lounge work harder: well-designed digital content can cut perceived wait times by up to 33% while directly increasing add-on sales through targeted messaging and interactive prompts. You’ll reduce perceived delays by combining real-time status updates with high-resolution screens that highlight loyalty discounts, trade-in bonuses and recommended services. Measurable customer engagement rises when you use short educational animations and interactive displays that demo benefits of add-ons (tires, fluids, detailing). Small games and promo triggers convert attention into purchases by presenting timely offers while anxiety’s low. Track uptake rates and AOV uplift to quantify ROI: a 10–20% bump in add-on conversion is common. Optimize rotation, CPM of content, and placement to maximize impressions per visit and revenue per service order.
Using DMS/CRM Data to Trigger Timely, Personalized Promos
Pairing your lounge’s dynamic content with DMS/CRM signals turns passive screens into revenue engines: by pulling service history, mileage, warranty status and past add‑ons you can trigger personalized promos at the exact moment they matter, increasing conversion and retention. You’ll use Customer Segmentation and Data Utilization to surface high‑value targets—warranty expirations, upcoming maintenance, or frequent add‑on buyers—and present tailored offers that studies show boost retention and repeat purchase likelihood.
Turn lounge screens into revenue engines by using DMS/CRM signals to trigger timely, personalized service and add‑on offers.
- Trigger maintenance package offers when mileage thresholds are hit
- Highlight warranty‑eligible repairs before expiration
- Promote add‑on bundles to customers with past purchases
- A/B test messages to optimize lift (up to 46% potential)
This approach delivers measurable ROI and higher service revenue.
Quick Implementation Checklist: Hardware, Software, and Workflows
Because every hour in your service bay costs money, a tight implementation checklist helps you get screens live fast and start tracking ROI immediately. Start with Hardware options: pick high-resolution displays and interactive kiosks to show live service updates and promos. For Software choices, deploy a CMS (e.g., Yodeck) to push consistent content across locations and integrate with your DMS/CRM. Define Workflow enhancements: digitize check-in, automate status updates, and reassign staff from manual entry to upsell tasks. Outline Content strategies: use dynamic visuals, service promotions, and vehicle-care tips to drive interaction and retention. Assign roles, set a 30–60 day launch timeline, and schedule weekly content reviews. This checklist minimizes ramp time and aligns tech, people, and messaging for measurable revenue lift.
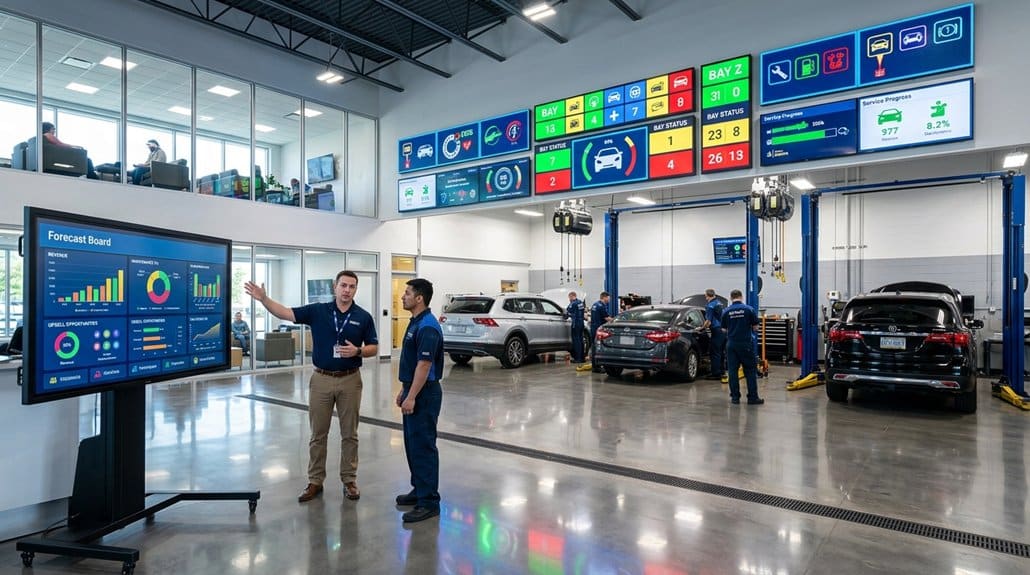
Metrics and ROI: What to Measure and How to Prove Revenue Impact
You’ve got screens live and workflows set — now measure what matters to prove revenue impact. Track customer engagement and performance metrics that tie directly to dollars: interaction rates, perceived wait-time reduction, upsell conversion, and revenue uplift from dynamic content. Use before/after comparisons and control groups for attribution.
- Interaction rate increase (up to 48%) correlated with higher service retention and revenue.
- Perceived wait-time reduction (up to 33%) boosting satisfaction and repeat visits.
- Upsell conversion tracked via analytics to quantify incremental gross profit.
- Revenue uplift analysis comparing foot traffic and sales pre/post digital signage.
Report ROI as incremental revenue minus costs, expressed as payback period and ROI percentage to justify scaling.
Frequently Asked Questions
What Is the $3000 Rule for Cars?
The $3000 rule for cars says you’ll average about $3000 in maintenance per 100,000 miles; that $3000 impact informs pricing strategy, letting you forecast lifecycle costs, improve ROI, and justify preventive service offers.
How Much Does a Car Salesman Make off a $20,000 Car?
You’d typically earn $1,000–$4,000 from a $20,000 car via commission structure (5–20%), or $150–$1,500 with flat fees; sales incentives and bonuses can push total earnings to about $2,000–$5,000 per sale.
How to Improve Car Dealership Sales?
You’ll skyrocket sales by obsessing over customer engagement and smart sales strategies: use data to personalize offers, track ROI, optimize pricing, train staff for upsells, and deploy timely digital touchpoints that boost conversions and loyalty.
What Is the 4 Square Method of Car Sales?
The 4 Square Method is a Sales Techniques framework you’ll use to break deals into price, trade‑in, down payment, and monthly payment squares; it’s ROI-focused, data-driven, simplifying numbers to optimize Closing Strategies and conversion rates.
Conclusion
Digital service‑drive signs deliver measurable revenue: transparent menus lift add‑on conversions, status boards speed throughput, and targeted promos boost average repair order. You might worry implementation costs outweigh benefits, but dealerships report payback in weeks—track ARO, flow time, and conversion to prove ROI. Start small: test one bay, integrate DMS triggers, and scale. With clear metrics and quick wins, signs pay for themselves while driving steady service growth.