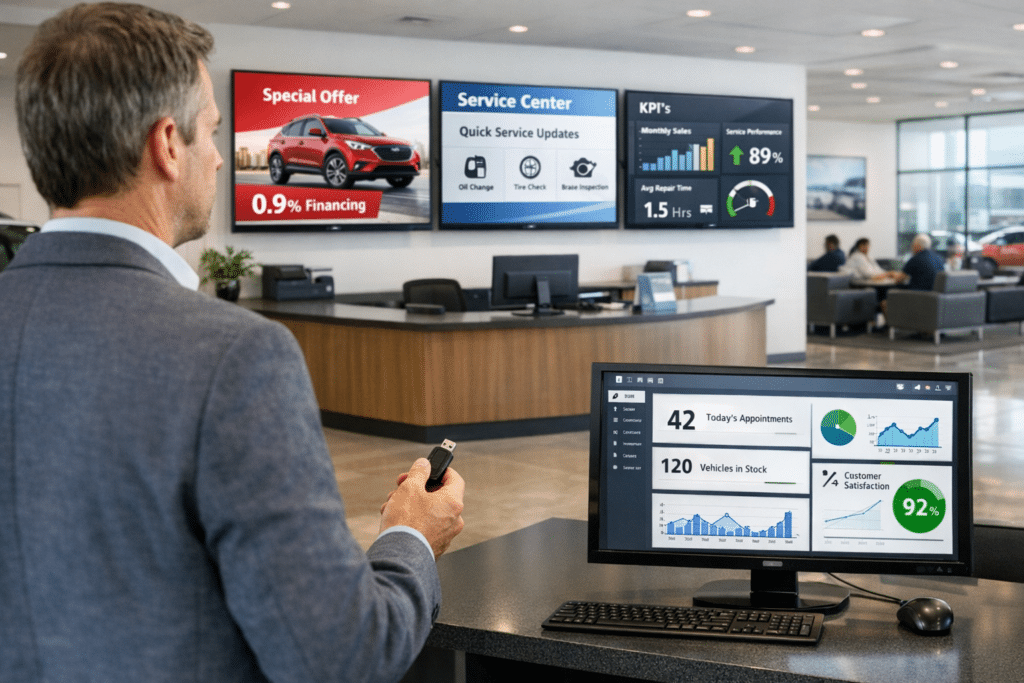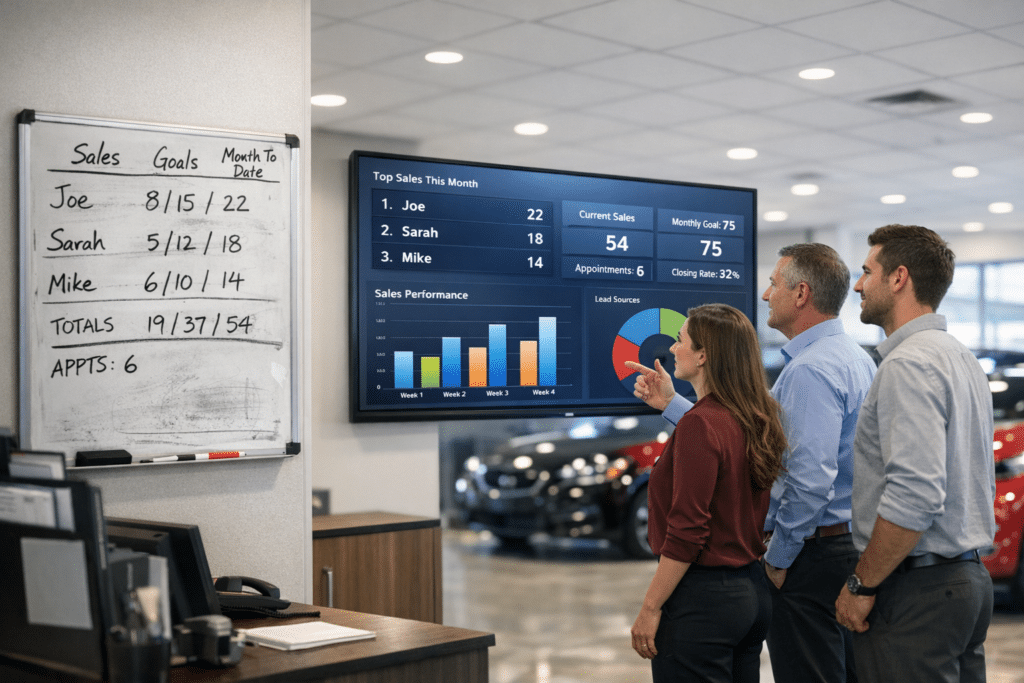
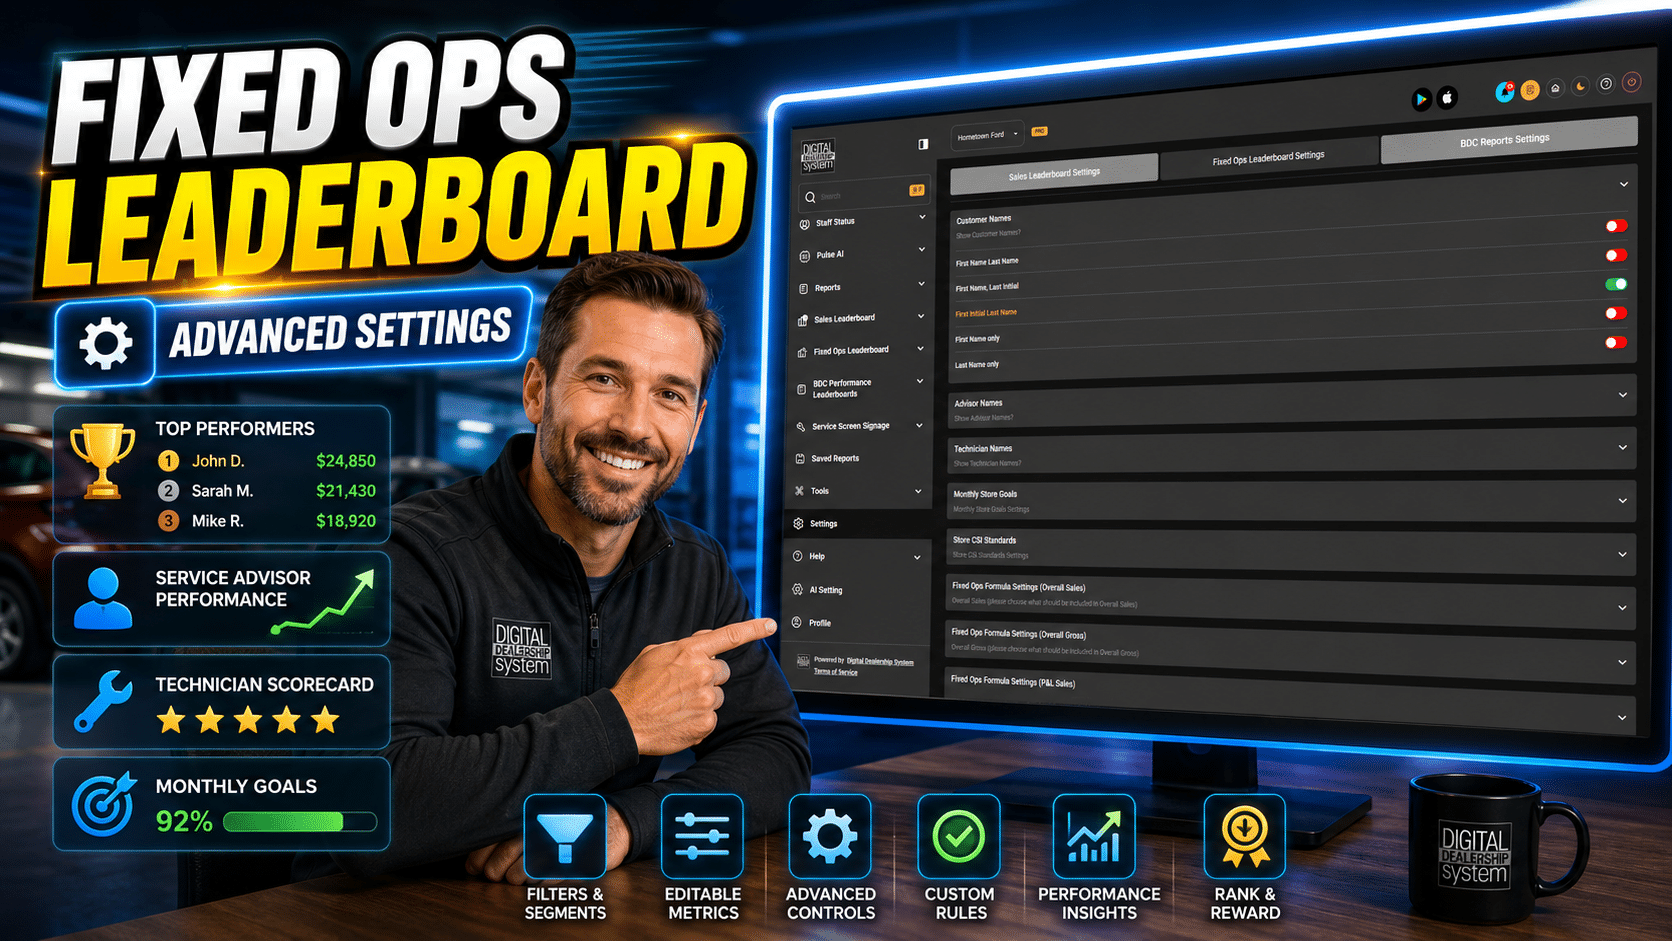
Digital Dealership System Leaderboards give Fixed Operations Directors and Service Managers a more direct way to manage performance throughout the workday. The Custom Fixed Ops Formulas feature helps dealership leaders define what belongs in overall sales, gross, labor sales, labor gross, parts sales, and related calculations; select the correct close or book date by pay type and role; and decide whether service contracts count as customer pay. Its value is not limited to displaying another report. It places useful information inside the daily management process, where a manager can see a signal, ask a better question, and take action while the result can still change.
Why custom fixed ops reporting formulas matters
Two fixed operations reports can use the same label while calculating it differently, which weakens confidence and creates reconciliation work. Dealerships already collect large amounts of information through the DMS, CRM, survey platforms, schedules, and internal worksheets. The management problem is rarely a lack of data. The problem is getting the right information into a form that can guide a conversation without hours of preparation.
Leaderboards address that gap by keeping the selected view visible and current. Managers can define what the team sees, reserve sensitive information for internal use, and create views that fit different roles. A GM may want store-level direction. A department manager may need staff detail. A team lead may need a filtered group. A public-facing screen may require a limited set of safe metrics. The feature supports the management purpose rather than forcing every audience into one generic report.
What the Custom Fixed Ops Formulas feature does
At its core, the feature allows dealership leaders to define what belongs in overall sales, gross, labor sales, labor gross, parts sales, and related calculations; select the correct close or book date by pay type and role; and decide whether service contracts count as customer pay. The configuration stays tied to the saved Leaderboard or account rules described in the feature. That matters because the view does not need to be rebuilt each time a manager wants current information. The selected structure remains useful while the connected data or source content changes.
A live operating view is different from a file attached to an email. A file records one moment. A live view applies its saved filters and definitions to the latest available information. That difference reduces the chance that two managers are discussing different versions. It also makes the tool useful between meetings, when staff behavior and customer activity are still developing.
A real-world dealership scenario
A Fixed Operations Director aligns advisor reporting to close date, technician reporting to book date, and excludes service contracts from customer pay to match the department’s financial statement. Every connected report then uses those definitions. The value comes from the management action that follows. The screen or desktop view gives the leader a clear starting point, the supporting detail helps verify the pattern, and the coaching conversation can focus on a behavior or process instead of a vague department-wide message.
“We matched the formulas to our statement and stopped maintaining a side spreadsheet to explain the differences. The board now speaks our language.” — Anthony Vega, Fixed Operations Director, Cypress Point CDJR
Illustrative manager perspective. The dealership and manager above are fictional and show how the feature could be used in practice.
How managers can put the feature into the daily routine
Opening drive review
The Fixed Operations Director checks department and lane performance before customer volume builds. The review should be short. Pick the key exception, identify who owns the next action, and return to the floor or drive.
Advisor coaching
The Service Manager uses the selected detail during a short one-on-one conversation based on actual repair-order activity. Use the screen as evidence, not as a replacement for leadership. A number can reveal where to look; the manager still needs to ask what happened and coach the next behavior.
Weekly operating review
Management compares current results with the store’s definitions and chooses one measurable process change for the next week. Keep the target stable long enough for staff to understand the standard and see whether the response is working.
Expected results for dealership staff
For staff, the expected gains include numbers aligned with store accounting, less spreadsheet reconciliation, better manager confidence, and fairer staff comparisons. Visibility reduces surprises. People can see how activity relates to goals and can ask questions before a month or pay period is over. The best use is specific and consistent: show the metric, explain why it matters, connect it to an action, and recognize improvement.
Staff acceptance rises when the data definitions are clear and the view matches dealership policy. Managers should explain what each number includes, who can see it, how often it changes, and how it will be used. That short explanation prevents the Leaderboard from feeling like an unexplained surveillance screen. It becomes a shared scorecard for the work the team already owns.
Expected results for management
Management should expect less time gathering routine information and more time interpreting it. A good setup creates a repeatable path from store result to department result, from department result to staff activity, and from activity to a coaching decision. It also gives leaders a common reference during meetings, which cuts down on side spreadsheets and competing definitions.
The strongest business case for custom fixed ops reporting formulas is speed. The feature helps the dealership see a gap earlier, locate the likely source, and respond with a targeted action. That does not promise an automatic revenue increase. It creates the management conditions that support better execution: visibility, accountability, consistent standards, and follow-through.
Practical setup guidance
Start with the management question, not every available field. Decide what decision the view should support, which audience will see it, and whether any customer or financial information must remain private. Select a small group of measures or content items that directly support that purpose.
Next, compare the result with the dealership’s trusted source. Confirm date rules, staff assignments, pay types, status definitions, formulas, and access. When the numbers match, introduce the view during a manager-led meeting. Explain the purpose and the action expected from staff.
Review the configuration after the team has used it. Remove fields nobody uses, refine the order, and create another role-specific view when one board is trying to serve conflicting audiences. The system supports multiple saved Leaderboards, so a manager does not need to overload a single screen.
Learn more
Digital Dealership System Leaderboards help dealerships turn current performance data into visible daily action. Learn more about the relevant Leaderboard program at Fixed Ops Leaderboard page or schedule a demonstration at schedule a demo.