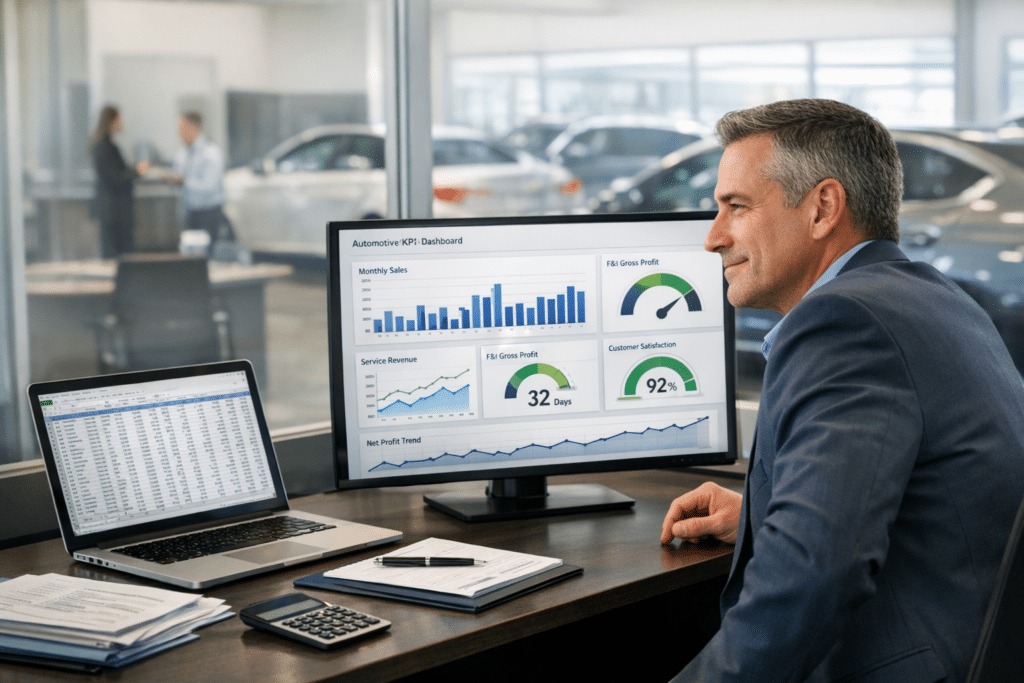

You get historical context from dealership sales reports—monthly and quarterly margins, unit trends, and profit analysis—while live sales leaderboards give real-time DMS-fed visibility, cut manual updates (about 187 minutes weekly), boost motivation (~72%) and productivity (~50%), and tighten feedback loops for faster tactical shifts. Reports guide long-term strategy; leaderboards drive daily accountability and conversion optimization. Continue for a tactical checklist, cost/scale guidance, and implementation steps to replace your whiteboard.
Key Takeaways
- Live sales leaderboards provide real-time performance visibility, while dealership sales reports summarize historical data for trend analysis.
- Leaderboards boost engagement and motivation immediately; reports inform strategic decisions over weeks or quarters.
- Automated leaderboards reduce manual entry and errors, saving about 187 minutes weekly compared to spreadsheet/whiteboard reporting.
- Reports focus on profitability metrics (gross per unit, margins); leaderboards highlight current volume and conversion activity for tactical adjustments.
- Choose Lite/Basic/Pro features and a staged rollout to balance cost, headcount, and analytics needs when replacing manual boards.
Reports vs Sales Leaderboards: Which Drives Faster Results?

Which actually moves the needle faster: static reports or live sales leaderboards? You’ll see leaderboards create a competitive advantage through real time engagement and clearer performance metrics, enabling data driven decisions every shift. Process-wise, they reduce manual entry—saving about 187 minutes weekly—and deliver dealer insights on daily units sold and gross performance so you can adjust tactics immediately. The data show motivational strategies work: leaderboards raise motivation 72% and productivity 50%, improving team dynamics and sales accountability via visible targets and peer comparison. Adopting this technology accelerates feedback loops, tightens coaching cadence, and standardizes engagement tactics. Static reports, while useful for historical context, can’t match the immediacy required for fast, operational change.
What Dealership Sales Reports Measure and Why It Matters
You’ll want reports that clearly track sales volume so you can spot trends in unit movement over time. They should break down profitability and margins to show where deals are earning or eroding profit. Also capture activity and conversion metrics—contacts, test drives, and close rates—to link front-end effort to outcomes and prioritize process fixes.
Sales Volume Tracked
While dealership sales reports give you a historical view of units sold over set periods—monthly or quarterly—to assess trends and overall performance, live sales leaderboards track sales volume in real time so managers can monitor daily unit counts, spot top and underperformers, and adjust tactics immediately. You’ll use sales reports to analyze sales trends and aggregate performance metrics across timeframes, identifying seasonality and long-term shifts. Conversely, live leaderboards surface current unit totals, individual contributions, and gaps that require immediate coaching. That shift from static summaries to dynamic tracking reduces manual reporting—saving about 187 minutes weekly—and improves operational tempo. By combining both, you’re able to benchmark historical expectations while driving day-to-day accountability and measurable improvements in unit throughput.
Profitability And Margins
Because margins drive whether volume translates into sustainable profits, dealership sales reports focus heavily on metrics like gross profit per vehicle, margin percentage, and contribution by model or channel so you can see where money is actually made. You’ll use profit analysis to track where acquisition cost, incentives, and pricing compress margins, and to distinguish high-volume low-margin deals from fewer high-margin sales. Regularly reviewing these reports lets you prioritize inventory and pricing actions that improve margin optimization rather than just volume.
- Identify top-performing models by gross profit per unit to concentrate stocking and promotions.
- Monitor margin percentage trends by channel to spot erosion from incentives or purchase cost swings.
- Flag underperforming segments for corrective pricing, sourcing, or sales training.
Activity And Conversion
One clear way to improve sales outcomes is to track activity and conversion metrics that show how prospecting, follow-ups, and showroom interactions turn into closed deals. Dealership sales reports give you historical totals—units sold, gross profit, finance penetration—but often depend on manual entry, creating accuracy gaps. Use activity tracking to quantify calls, appointments, test drives and follow-ups; compare those activity levels to conversion rates to pinpoint weak process steps. Because reports can lag, you may miss timely coaching windows; stale data reduces accountability and slows resolution of performance issues. Prioritize conversion optimization by correlating recent activities with closed-deal outcomes, then adjust scripts, cadences, and handoffs. That process-driven focus improves predictability, margins, and overall profitability.
How Fresh Is the Data? Batch Reporting vs Hourly DMS Updates
How recent is the information your team relies on—minutes, hours, or days old? Batch reporting harms data freshness: reports delayed by hours or days reduce performance accuracy and obscure sales insights, while hourly DMS updates improve update frequency and decision speed. You’ll reclaim time lost to manual entry (over 187 minutes weekly) and cut reporting delays that blunt responsiveness.
- Hourly DMS updates: real-time sales insights, better performance accuracy, immediate feedback loops.
- Batch reporting: slower update frequency, stale data, weaker decision speed and distorted team dynamics.
- Impact metrics: reduced manual work, higher motivation factors, faster corrective actions and clearer accountability.
Adopt processes that prioritize continuous feeds to optimize decision speed and team dynamics.
What Live Sales Leaderboards Show on the Sales Floor
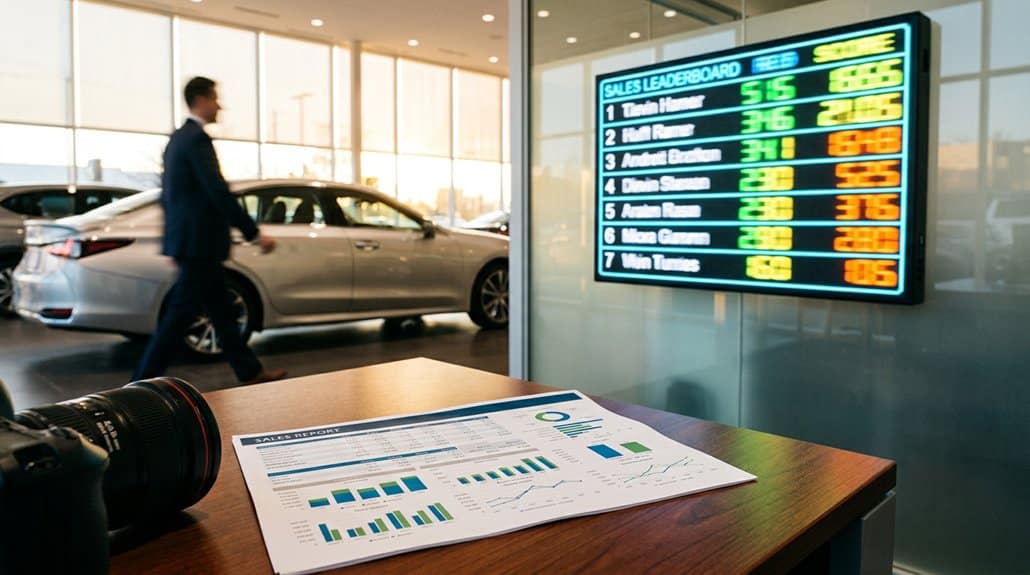
Visibility drives behavior: live sales leaderboards give your floor a constantly updated snapshot of individual and team performance—units sold, gross profit (MTD/YTD), and rank—pulled hourly from the DMS so the numbers reflect current reality rather than stale reports.
You’ll see concise performance metrics that drive team accountability and sales motivation. Real time updates from digital tools guarantee data accuracy; visual engagement makes standings obvious. Achievement recognition is immediate, fueling a competitive atmosphere while gamification impact increases daily output. Use the board to audit trends, reallocate resources, and set short feedback loops so processes improve. Metrics focus: units, gross, rank, MTD/YTD, conversion. The table below highlights core fields you’ll monitor.
| Metric | Purpose |
|---|---|
| Units Sold | Output measure |
| Gross (MTD/YTD) | Profit focus |
| Rank | Competitive cue |
| Timestamp | Real time updates |
| Owner | Team accountability |
Visibility: Static Reports vs TV-Ready Leaderboards
While static reports can give you a historical snapshot, they quickly lose relevance as new sales data comes in, whereas TV-ready leaderboards pull continuous updates from the DMS so the floor sees current numbers, not yesterday’s. You’ll get real time visibility that removes guesswork and reduces manual entry—saving teams over 187 minutes weekly. Large-format displays present concise KPIs, boosting motivation up to 72% and increasing competitive engagement through visible ranks and progress bars. Processes shift from periodic reporting to continuous feedback loops, enabling immediate coaching.
- Continuous feed: automated DMS syncs provide live accuracy and eliminate stale spreadsheets.
- Floor-ready design: readable at a glance for faster decisions and accountability.
- Measurable impact: time saved and engagement gains drive operational ROI.
Actionability: Strategy Reports vs On-Floor Leaderboards
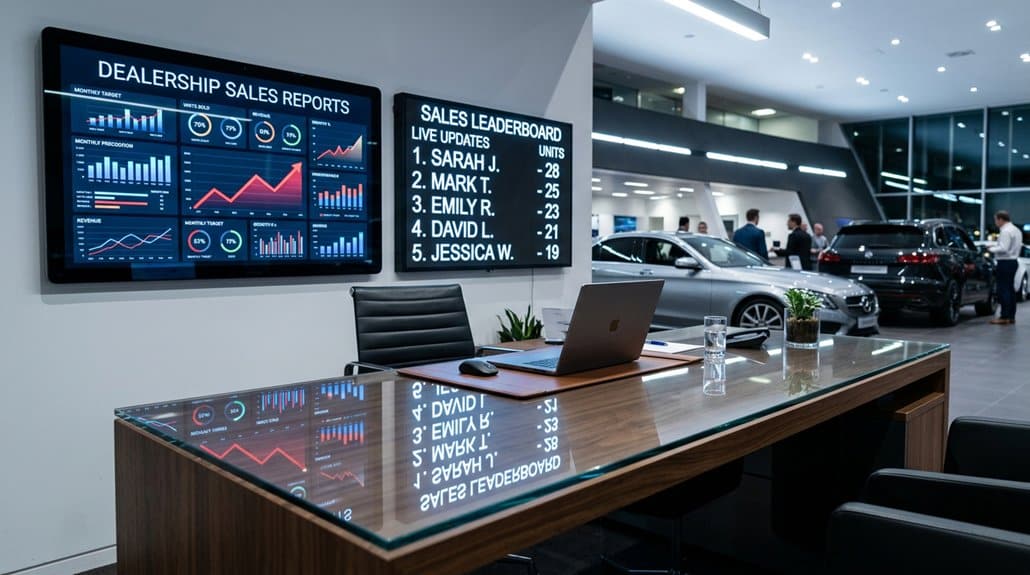
Because strategy reports summarize past performance, they rarely give you the real-time cues needed for on-the-spot decisions; they’re retrospective, dense, and slow to turn into actionable insights. You need on-floor leaderboards for immediate feedback and real time adjustments—displayed metrics drive visual engagement and make goal alignment obvious. Process-wise, leaderboards convert data into signals you can act on: coach a rep, reassign leads, or push a promotion. That creates performance accountability and strategic motivation while supporting positive team dynamics and a healthy competitive spirit. By contrast, periodic reports force you into after-the-fact analysis. If you want data driven decisions that change behavior now, prioritize live displays that prompt quick coaching, reinforce targets, and close the feedback loop.
Accuracy & Labor: Whiteboards, Spreadsheets, and Automated Pulls
Accuracy is where manual whiteboards and spreadsheets break down: you’re losing roughly 187 minutes a week to entry errors and rework, which skews performance metrics and eats selling time. Automated pulls from your DMS restore data integrity, enable real-time performance tracking, and cut labor tied to manual updates. You’ll see efficiency gains and measurable error reduction, while workflow automation standardizes inputs and improves team collaboration for faster coaching.
- Replace manual entry: reduces errors, frees 187 minutes/week, lowers labor costs.
- Implement automated pulls: preserves data integrity, supports instant performance tracking.
- Use live leaderboards: improves team collaboration, accelerates decisions, maximizes efficiency gains.
Adopt automation to minimize rework and optimize selling time.
Motivation: How Sales Leaderboards Change Behavior
Automating data pulls and live leaderboards doesn’t just save about 187 minutes a week and cut errors — it reshapes behavior by applying measurable incentives and real-time feedback. You’ll see behavioral shifts as motivation drivers like gamification increase motivation by 72% and productivity by 50%. Real-time accountability measures let you adjust tactics instantly, reinforcing performance recognition and creating a recognition culture. Visible standings stoke competitive spirit while structured engagement strategies improve team dynamics and lift engagement up to 60%. Immediate feedback loops boost morale and can drive up to 45% better sales margins.
| Metric | Impact |
|---|---|
| Motivation | +72% |
| Productivity | +50% |
| Engagement | +60% |
| Sales margin | +45% |
Cost & Scale: Choosing Lite, Basic, or Pro for Your Store
Many dealerships will find that choosing between Lite, Basic, and Pro boils down to balancing current headcount and reporting needs against budget and growth plans. You’ll evaluate Cost Efficiency and Scalability Options: Lite Features give an affordable entry point for single-rooftop operations; Basic Benefits add unit and gross tracking for steady teams; Pro Insights deliver granular salesperson, manager, and finance production for larger stores. Implementation Strategies should prioritize minimal disruption and preserve Data Continuity during upgrades. Focus on User Experience metrics—adoption rates, time-to-insight, and training hours—to justify spend. Use a staged rollout: validate Lite Features, expand to Basic Benefits when volume grows, and adopt Pro Insights when detailed accountability drives ROI. Track outcomes quantitatively.
- Headcount vs. features
- Budget vs. ROI
- Adoption vs. analytics
Replace Your Whiteboard: A Quick Checklist to Decide
Start by measuring how many of the 187+ weekly minutes your team spends on manual board updates to quantify time loss. Then compare the low monthly cost of a digital leaderboard against the demonstrated 72% motivation and 50% productivity gains to calculate ROI. Finally, map three simple implementation steps — data feed from the DMS, automated display setup, and a one-week pilot — to minimize disruption and confirm value.
Assess Current Board Time
If your team still updates a whiteboard by hand, you’re likely spending precious hours on redundant data entry—on average about 187 minutes per week—that could be reclaimed for selling and customer follow-up. Assess current board time by measuring how long updates take, which tasks repeat, and where data accessibility breaks down. Track time for daily, weekly, and monthly updates and compare against automated refresh intervals you’d get from a live leaderboard.
- Quantify: log minutes per update and total weekly hours to reveal true opportunity cost.
- Diagnose: identify manual steps, version conflicts, and delays that hurt current efficiencies.
- Decide: map required real-time fields, integration needs, and scalability for a digital shift.
Compare Cost Versus Value
Now that you’ve measured how much time your team spends on manual board updates, compare the hard costs and measurable benefits of keeping the whiteboard versus adopting a digital leaderboard. Perform a cost analysis: quantify 187 weekly minutes lost to manual updates and translate into labor dollars. Run a value assessment: Sales Leaderboard Lite’s automation reduces that time, drives a 72% motivation lift, and improves engagement—metrics tied to sales output. Model financial impact and investment return considering the low monthly pricing strategy starting at $499. Include budget considerations and an affordability comparison against recurring labor and error costs. Use cost benefit calculations to show payback period and forecasted revenue uplift, letting you decide on the most efficient spend.
Plan Easy Implementation Steps
Because you’ve quantified the time and cost lost to manual updates, deciding to replace your whiteboard should follow a simple, data-driven checklist:
- Estimate ROI: confirm 187+ saved minutes/week and compare against costs (starting at $499/month) to justify purchase and set an implementation timeline of 3–5 days.
- Define setup steps: map data sources, integrations, display locations, and a rollout schedule that minimizes disruption; target operational status within the streamlined setup window.
- Plan adoption: schedule concise user training, assign managers for real-time coaching enabled by the leaderboard, and set metrics for accountability and motivation.
Follow this checklist to minimize downtime, guarantee fast value capture, and measure the impact on coaching and team engagement.
Frequently Asked Questions
What Are the Disadvantages of Leaderboards?
You’ll face competitive pressure, transparency issues, motivation imbalance, and accuracy concerns: leaderboards can stress low performers, obscure teamwork, skew incentives toward top ranks, and propagate outdated or role-misaligned data unless processes guarantee timely, fair measurements.
How Much Does a Car Salesman Make off a $20,000 Car?
You’d earn roughly $400 on a $20,000 car if profit’s $2,000 and your commission structure is 20%; numbers show range $200–$600+ depending on profit, bonuses, flat fees, and salesperson motivation driving performance.
How to Create a Sales Leaderboard?
Choose sales metrics (units, gross, CSI), integrate a DMS-connected platform, automate real-time performance tracking, design visual rankings, add gamified rewards, update regularly in meetings, and use data to iterate goals and improve team outcomes.
What Is the Purpose of a Leaderboard?
A leaderboard’s purpose is to provide leaderboard benefits by delivering real-time metrics that drive competitive motivation, enabling you to track performance, identify coaching opportunities, reduce manual errors, and systematically boost productivity through measurable, data-driven processes.
Conclusion
You’re choosing between snapshot reports and live leaderboards, so think like an operator: reports give audited, retrospective insights; leaderboards drive immediate, measurable activity. Use reports for accuracy and compliance, leaderboards for tempo and motivation. Match tooling to scale and staffing—automate pulls to cut labor, prefer hourly DMS syncs for freshness, and replace whiteboards when errors exceed the value they create. In short, pick the right instrument to move the KPI needle.