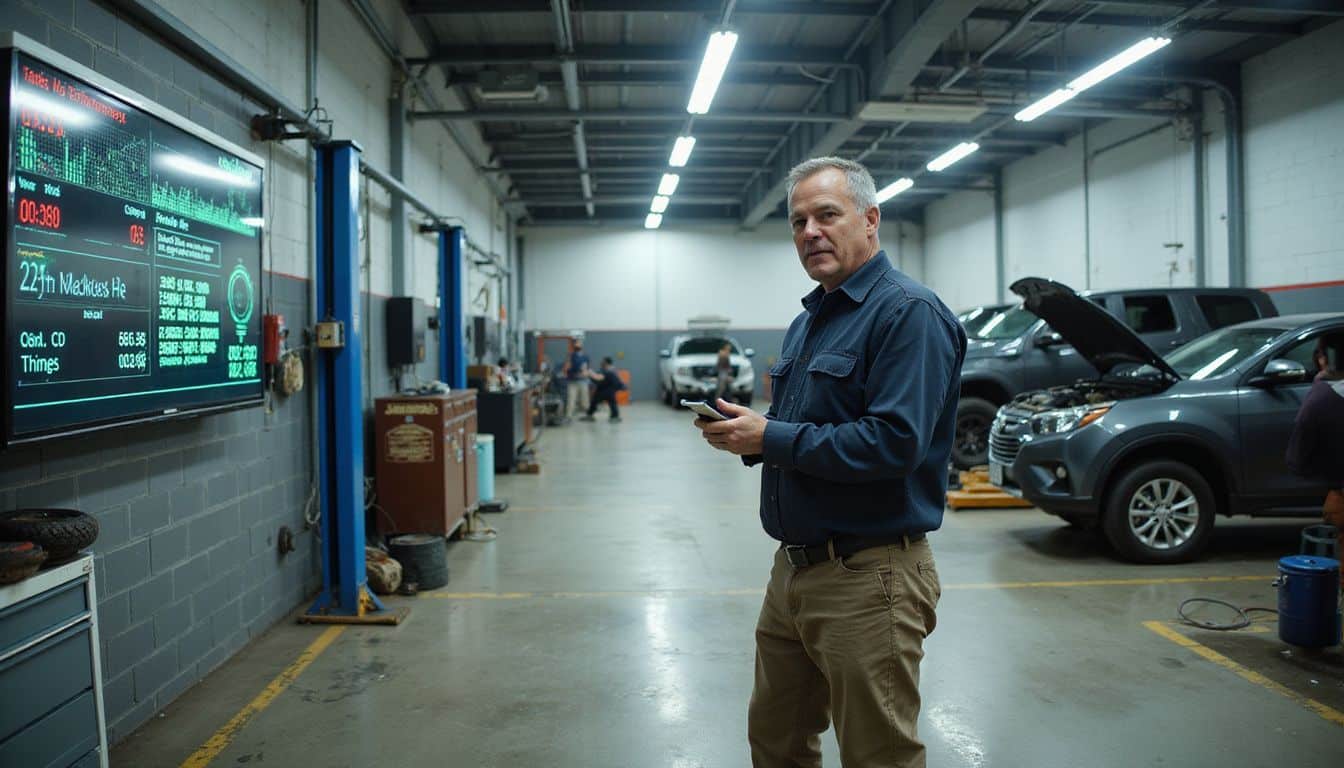
Ever glance at your service department’s numbers and wonder why the overhead still feels so heavy?
You’re probably leaving money on the table right now. The average dealership only covers 68.1% of its overhead through fixed operations, which means most stores fall short of true financial stability.
Here’s the good news. Live target-tracking boards show you exactly where your technician productivity gaps hide, and how to close them fast.
I’ll walk you through how real-time visibility can turn your service absorption rate from a worry into a strength, one step at a time.
Key Takeaways
- Live target-tracking boards help dealerships push fixed operations absorption rates from the current industry average of 68.1% toward full coverage of overhead costs.
- Real-time visibility into technician productivity, service gross profit per repair order, and customer pay mix lets you spot performance gaps and act on them fast.
- Service departments that align with sales teams through shared metrics on digital signage strengthen customer retention and boost long-term dealership profitability.
- Technician productivity improves when workers track hours billed against hours available every day, cutting idle time and unapplied labor costs that drain absorption rates.
- Data-driven decisions through live boards turn abstract numbers into actions that improve labor sales, parts margins, and overall operational stability.
What Are Fixed Operations Absorption Rates and Why Do They Matter?

Your service department makes money two ways: labor sales and parts sales. Fixed operations absorption rates measure how well your dealership covers operating expenses through these two revenue streams, and the number hits your bottom line directly.
What is the definition of fixed operations absorption rates?
Fixed operations absorption rates measure how much of your dealership’s overhead the service, parts, and body shop departments cover through their gross profit. Think of it as a financial health check. The formula divides your total gross profit from these departments by your total operating expenses.
Hit 100% absorption, and you’ve wiped out the sales floor’s cost burden entirely. Every vehicle you sell then flows straight to profit instead of covering bills.
According to NADA data, the average service absorption rate reached 68.1% in Q1 2025, a solid improvement across the industry. Service and parts departments also run at unusually strong margins, typically between 45% and 55%, according to a late 2025 McKinsey analysis of U.S. auto dealer groups. That high margin explains why fixed ops can carry so much of your dealership’s overhead weight.
Service absorption shows how much of the dealership’s overhead is covered by fixed ops gross profit before any vehicle sales.
Here’s what your absorption number tells you at a glance:
- Below 70%: You’re vulnerable when sales dip, and slow months hit your bottom line hard.
- 70% to 90%: You’re building resilience, but there’s still room to tighten performance.
- 100% or higher: Fixed ops covers your overhead completely, so every vehicle sale becomes pure profit.
This metric shows up on your financial statement, and it shapes how dealer principals judge performance across service advisors, technician efficiency, and parts pricing strategies. Understanding this foundation helps you see why live target-tracking boards become essential tools for pushing these numbers higher and keeping cash flow steady.
Which key metrics affect absorption rates?

Now that you know what fixed operations absorption rates represent, let’s zoom in on the specific metrics that drive those rates up or down. Think of these metrics as the dials on your dashboard. Each one controls how fast you move toward your profitability goals.
| Metric Category | Metric Name | What It Measures | Why It Matters to Your Absorption Rate |
|---|---|---|---|
| Labor Performance | Effective Labor Rate (ELR) | Average labor dollars you collect per labor hour sold | Higher ELR means more revenue from each technician hour, directly boosting gross profit from service department |
| Labor Performance | Hours Per Repair Order (HPRO) | Average labor hours sold per RO | More hours per job means higher service revenue and improved margin per repair order |
| Technician Productivity | Productivity Percentage | Hours Billed divided by Hours Available | Tracks how much of available time your team actually sells; idle time kills absorption |
| Technician Productivity | Efficiency Percentage | Hours Billed divided by Hours Worked on Jobs | Measures how effectively technicians complete work; rework and slowdowns reduce this metric |
| Parts Department | Parts Gross Profit Percentage | Parts Gross Profit divided by Parts Sales | Shows profit margin on parts; this gross profit flows directly into your absorption calculation |
| Parts Department | Parts Turns | Annualized Parts COGS divided by Average Inventory | Fast inventory turnover reduces carrying costs and frees capital for operations |
| Service Profitability | Service Gross Profit per RO | Total profit generated from each repair order | This metric combines labor margin, parts margin, and sublet margin into one powerful number |
| Service Profitability | Gross Margin Percentage | Profit percentage on each service visit | Reflects pricing strategy and cost control; feeds into the numerator of your absorption formula |
| Customer Retention | Customer Pay Retention | Percentage of customers who return for service | Repeat customers generate predictable labor sales that stabilize fixed ops revenue streams |
How Do Live Target-Tracking Boards Improve Fixed Operations?
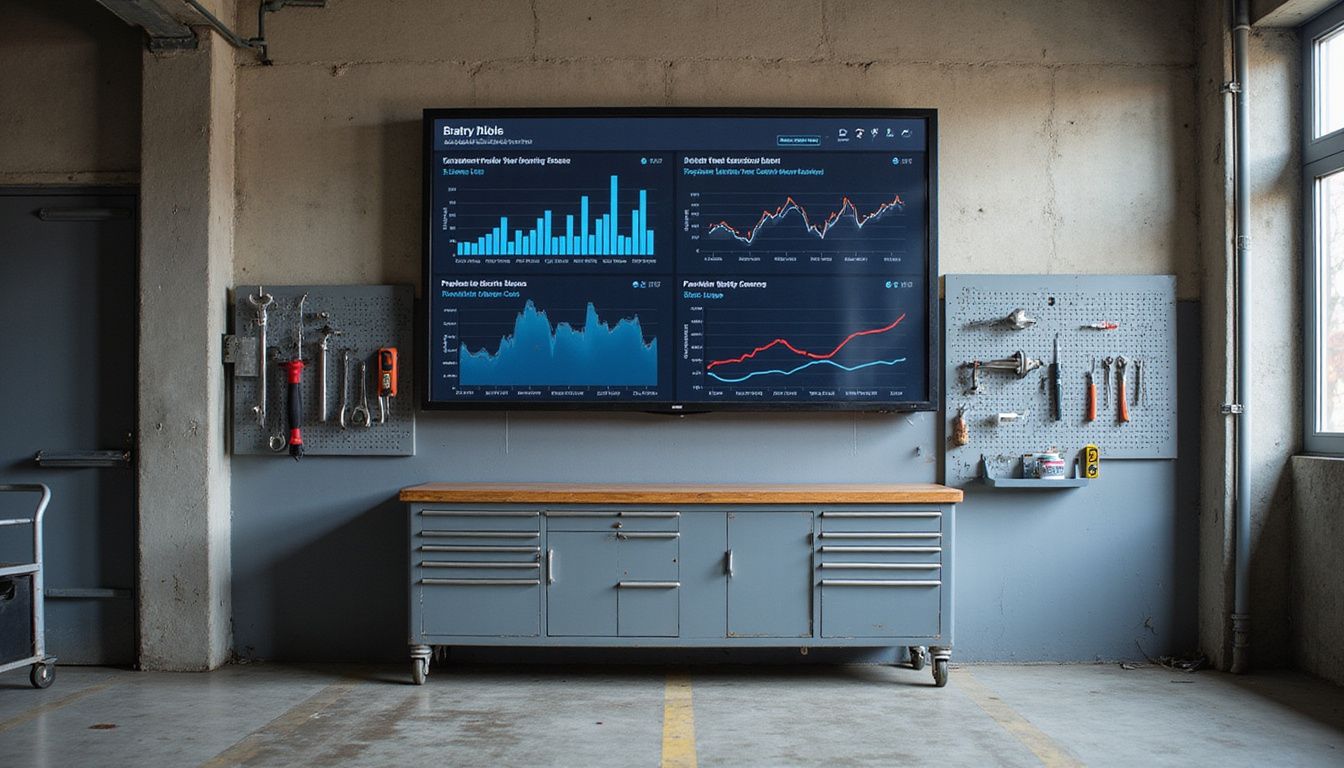
Your service team moves faster when they see performance metrics on a screen right in front of them. Live target-tracking boards show your technicians, service advisors, and managers what matters most: hours per RO, customer pay mix, preventative maintenance uptake, and unapplied labor costs, all in real time.
How do live boards provide real-time visibility into performance?
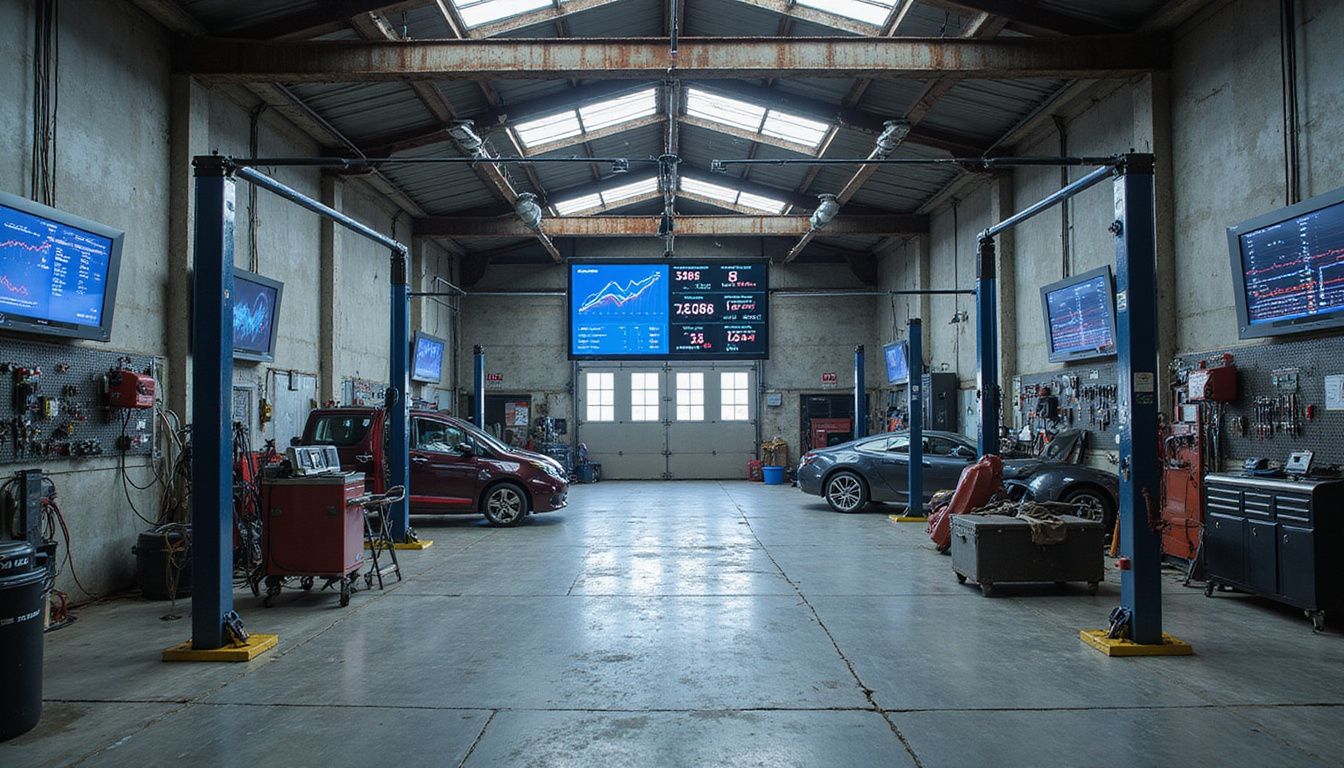
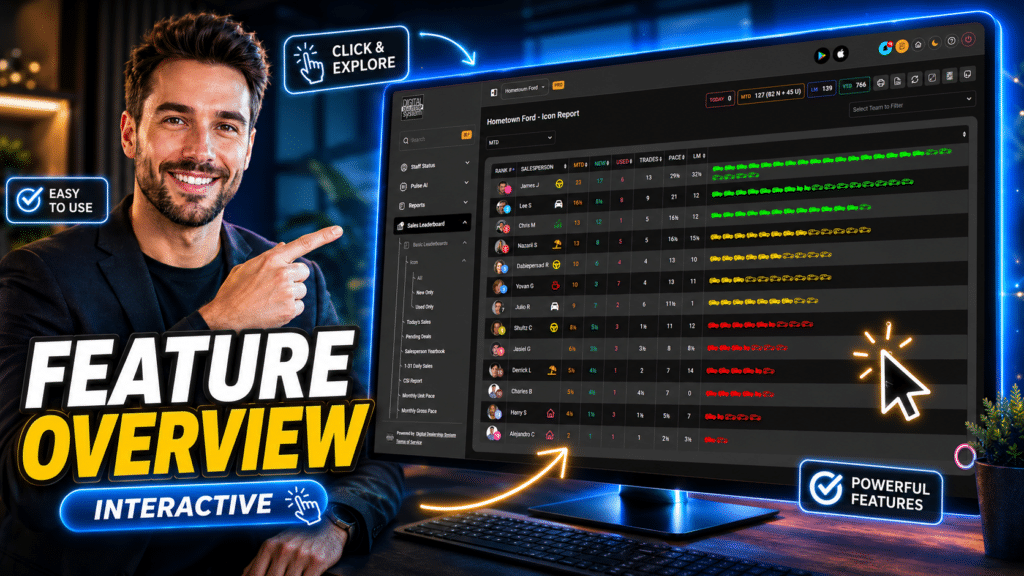
Live target-tracking boards put performance metrics right in front of your team. No more digging through spreadsheets or waiting for monthly reports. Technicians see their hours per RO, service gross profit per repair order, and customer pay mix on digital signage throughout the service drive.
This real-time visibility lets your staff spot bottlenecks in fixed operations immediately, instead of discovering problems weeks later. Data flows straight from your dealership systems to the boards, keeping information accurate without the manual entry errors that plague scattered reports.
Here’s what this looked like at one independent dealership that installed ceiling-mounted digital tracking boards across the service drive and advisor stations, all fed directly by their DMS. Over a six-month pilot, the results spoke for themselves:
- Fixed ops absorption climbed from 62.0% to 88.0%.
- Technician productivity jumped from 63% to 78%.
- Effective labor rate rose from $82 to $90 per hour.
- Parts gross margin improved from 43% to 45%.
- Unapplied labor incidents dropped 70%.
The service manager noted that seeing hour targets and absorption on the wall changed daily decisions. Technicians and advisors stopped guessing and started capturing the small wins that add up.
What gets measured gets managed, and live boards make measurement impossible to ignore.
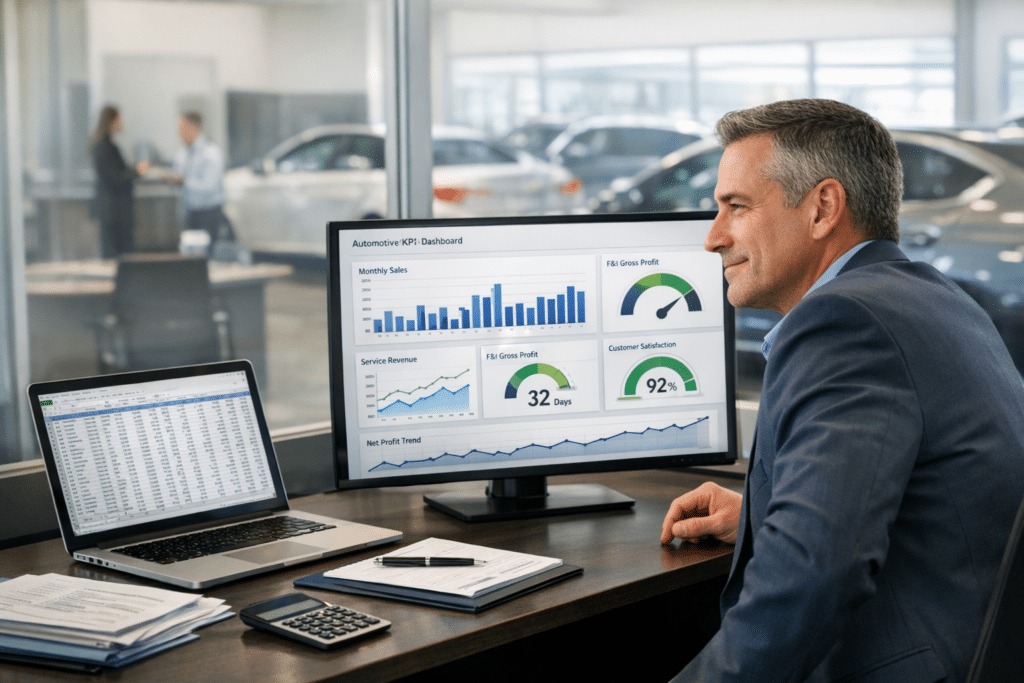
Technician proficiency improves faster when workers track their own performance against benchmarks throughout the day. Your team watches absorption rates climb or drop in real time, which sparks immediate conversations about what’s working and what needs adjustment. Service and sales departments also align better, since everyone watches the same KPI scorecard instead of guessing at priorities.
This shared view matters because it centralizes performance data into one standardized picture, so you’re comparing apples to apples month after month. Changing which metrics you track from month to month makes it nearly impossible to see true progress or spot where unapplied labor costs eat into profits.
The boards turn abstract numbers into visual stories that drive action, helping your dealership close performance gaps before they turn serious. Digital signage shapes customer behavior too. According to the 2023 Deloitte Automotive Experience Report, digital displays in service wait areas cut perceived wait times by 27% and lift optional maintenance package acceptance by 19%.
How does live data enhance decision-making?

Visibility alone doesn’t win the game. Action does. Real-time data turns what you see on your tracking board into decisions that move the needle, since your DMS labor sales reports feed live numbers straight into the board, showing appointment flow against capacity right now.
See a bottleneck in your service bay? Adjust immediately. Notice technician productivity dipping? Investigate the root cause today, not next month. Speed matters here because your fixed absorption rate depends on how fast you respond to problems.
McKinsey research confirms that companies making data-driven decisions outperform competitors by significant margins. Your team stops guessing and starts knowing.
Spot-checking internal repair orders becomes second nature once you’re tracking live. Here’s what that catches:
- Billing errors before they slip through unnoticed.
- Declined work that could have walked out the door.
- Labor sales capacity issues before they tank your month-over-month numbers.
Your service and sales departments align because both teams see the same numbers at the same time. Owners and dealer principals set action items like pricing audits and discount control, then track progress in real time.
Monthly fixes happen faster when data stares back at you from the board. Equity mining opportunities surface quickly, and your variable operations costs stay controlled because you’re no longer flying blind. The board becomes your command center, not just a pretty display.
Benefits of Using Live Target-Tracking Boards
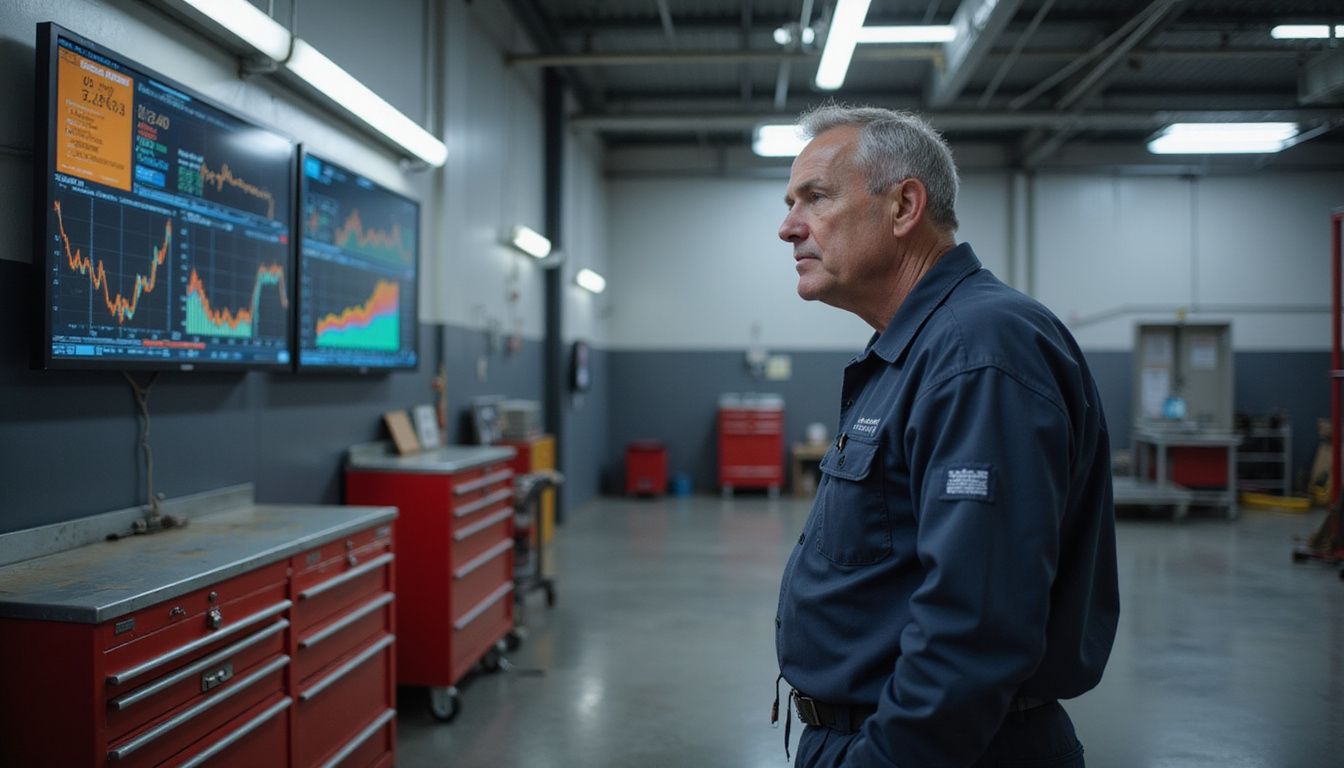
Your team watches real-time data flow across digital signage, and technician productivity jumps because everyone sees the same targets. Service gross profit per repair order climbs when your staff stops guessing and starts acting on live information that matters.
How can technician productivity and efficiency improve?

Your technicians spend hours in the shop, but not all of that time turns into billable work. Technician Productivity measures Hours Billed divided by Hours Available, while Efficiency measures Hours Billed divided by Hours Worked on Jobs.
These two numbers matter because every small efficiency gain flows straight to profit, helping cover the overhead costs that drain dealership resources. Live target-tracking boards display these numbers in real time, so technicians see exactly where they stand against daily goals.
Common performance leaks show up in a few predictable spots:
- Gaps in dispatch that leave technicians waiting for their next job.
- Delays in parts arriving or approvals coming through.
- Unbalanced scheduling that overloads some bays and empties others.
- Comebacks that pull technicians away from new, billable work.
When you pre-pull parts for scheduled services, technicians avoid waiting around for inventory to arrive. Protecting diagnostic capacity means scheduling appointments that match actual shop volume, which eliminates idle time that kills profitability. Improving shop flow changes how fast technicians move between bays, and parts availability directly impacts that transition speed. Having materials ready before a technician needs them prevents bottlenecks before they start.
Digital signage displaying live metrics keeps everyone focused on the same targets, creating accountability across the whole service department. Higher technician productivity correlates directly with increased dealership profitability, since you’re billing more labor hours in the same timeframe.
Reducing unapplied labor costs protects financial stability and keeps your service department competitive in the automotive industry. Aligning technician schedules with appointment volumes eliminates wasted time and maximizes billable hours, which strengthens your bottom line and supports long-term growth.
How do tracking boards increase service gross profit per repair order?

Live tracking boards transform how you capture and measure service profit at every repair order, turning data visibility into dollars in your pocket.
| How Tracking Boards Drive Service Gross Profit Per RO | Real Impact on Your Bottom Line |
|---|---|
| Real-Time Labor Sales Visibility Tracking boards display current labor hours sold per repair order as work happens. Advisors see exactly which ROs are hitting targets and which ones are falling short. This visibility catches gaps before the day ends, not after the invoice prints. | You stop leaving money on the table. Service advisors catch missed upsell opportunities during vehicle check-ins. A quick battery replacement or wiper blade swap adds labor revenue without extending shop time. Small captures add up across dozens of ROs monthly. |
| Segregating Pay Types for Smarter Decisions Boards separate customer pay work from warranty and internal jobs. This breakdown matters because each pay type carries different margins and profitability. Customer pay typically delivers higher gross profit per RO than warranty work. | Separating these categories reveals which work types actually move the needle on service gross profit. Technicians focus energy on high-margin customer pay jobs first. Warranty work gets scheduled efficiently without consuming prime labor capacity. |
| Controlling Subcontracting Leakage Live boards flag when work gets sent out to external shops. Subcontracting reduces gross profit per RO because outside labor costs cut into margins. Boards help identify patterns in what gets outsourced and why. | Tracking this metric lets you build internal capacity for high-volume outsourced work. Bringing jobs in-house directly increases service gross profit. Even small reductions in subcontracting add meaningful dollars to monthly profitability. |
| Preventing Comeback Costs Boards track repeat visits and warranty comebacks on specific ROs. Comebacks destroy profit margins because they consume labor without generating new revenue. Visibility into comeback patterns helps quality control improve fast. | Fewer comebacks mean higher service gross profit per original repair order. Technicians see their comeback rates displayed publicly. This accountability drives quality improvements that protect margins and customer satisfaction. |
| Optimizing Pay-Type Mix Boards show the ratio of customer pay to warranty to internal work across your schedule. This mix heavily influences gross profit per RO. Shops with more customer pay work generate higher profit on the same labor hours. | Understanding pay-type mix lets advisors steer incoming work toward higher-margin opportunities. Promoting preventative maintenance packages to customers shifts work toward customer pay. This strategic scheduling lifts service gross profit across all repair orders. |
| Identifying Internal Policy Leakage Boards reveal when internal policies drain profit without offsetting value. Examples include free services, extended warranties, or complimentary inspections. Tracking these costs shows exactly how much they reduce gross profit per RO. | Eliminating unnecessary leakage puts money back into margins. Small policy adjustments across hundreds of repair orders create significant annual profit improvements. Boards make this invisible cost suddenly visible and actionable. |
| Capturing High-Margin Preventative Work Boards display which mileage-based maintenance services were recommended and sold. Service advisors see in real time which customers accepted preventative packages. This tracking reinforces which recommendations resonate and drive sales. | Preventative maintenance carries higher margins than reactive repairs. Boards help advisors promote value-based packages consistently, and the payoff is real. Based on findings from the 2026 Cox Automotive Fixed Operations and Ownership Study, per-repair order spend jumps from $103 to $160 when advisors send customers photos and videos of recommended work. Routine services become comprehensive maintenance events that boost labor sales and parts revenue per visit. |
How do tracking boards align service and sales departments better?
Your tracking boards do more than boost repair order profits. They break down the walls between your service and sales teams. In siloed operations, a salesperson just hands over the keys to a customer. In unified operations, they personally introduce that customer to a service advisor.
This shift matters because salespersons who skip that introduction hand over future service revenue to competitors. According to a 2025 Cox Automotive Service Industry Study, customers who service their vehicle at a dealership are 74% more likely to buy their next vehicle from that same store. That single stat should be enough to get your sales team paying attention to fixed ops.
Your digital signage displays real-time data that both departments can see at the same time. Service advisors know exactly which trade-in vehicles came from sales, and sales staff understand current service capacity and upcoming maintenance needs. Unified training cements this alignment even further. Here’s what that looks like in practice:
- Service advisors who flag trade-in opportunities to sales, instead of missing the chance.
- Staff who learn the same methods and speak the same language across departments.
- Shared goals that bridge fixed and variable operations instead of splitting them apart.
Cultural disconnection between departments hurts customer loyalty and slows growth. Tracking boards display performance metrics that apply to both teams, creating accountability that spans service and sales.
Your customer experience improves because both teams work toward the same outcome instead of separate agendas. This integrated approach strengthens your position against National Automobile Dealers Association benchmarks and builds lasting relationships with customers.
How to Increase Absorption Rates Using Tracking Boards
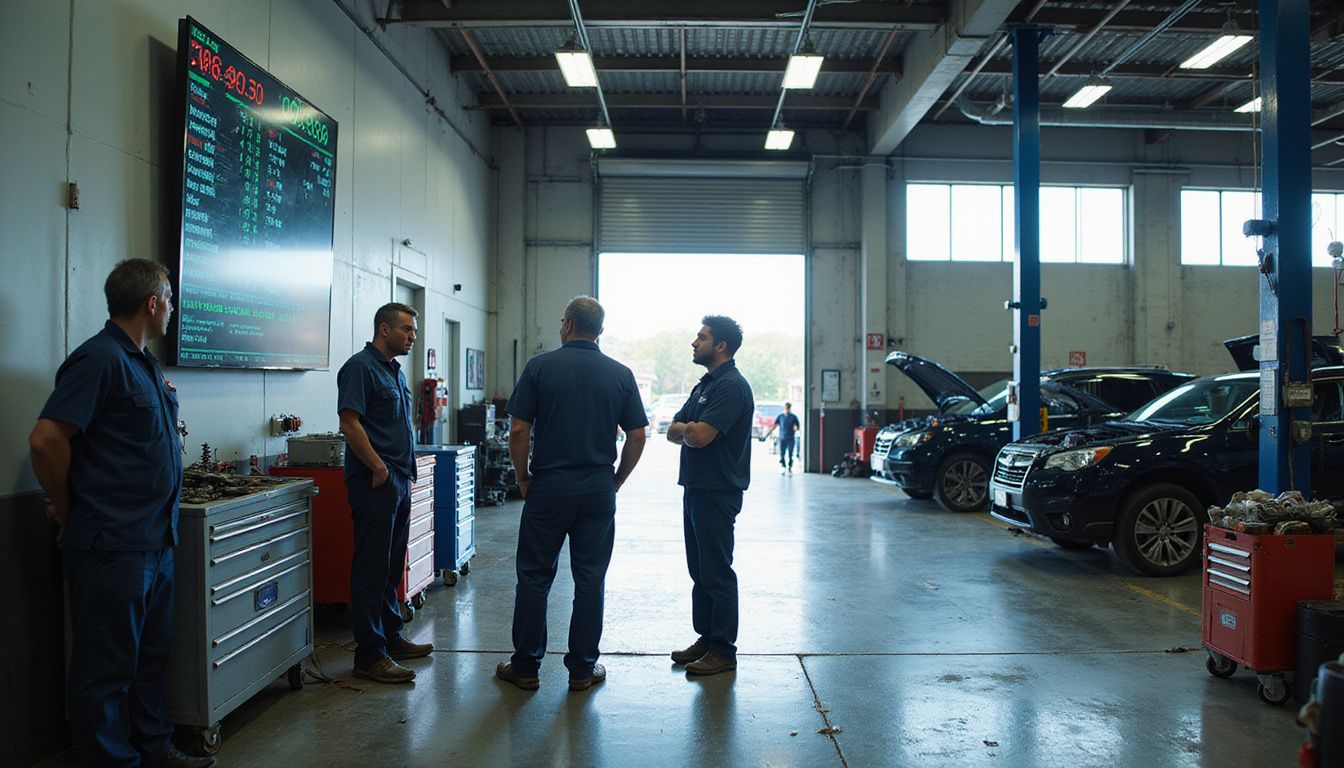
Your team needs clear targets and real numbers to hit them. Live tracking boards show your technicians exactly where they stand against those goals, right now, so they can adjust their work and push absorption rates higher.
How to set measurable goals and benchmarks?

Setting clear targets transforms your service department from guessing to winning. Live target-tracking boards make these goals visible to every team member, every single day.
Start with these customer and revenue-focused benchmarks:
- Establish a 100% absorption rate as your primary scorecard metric during monthly principal reviews, surpassing the current industry average of 68.1%.
- Track rolling customer pay retention weekly to measure how many service customers return for their next visit. The stakes are high: according to the 2026 Cox Automotive Fixed Operations and Ownership Study, dealerships lose an estimated $12,398 in potential lifetime service spend every time a new-vehicle buyer defects to an independent shop.
- Monitor next-visit appointment set rate each week, capturing the percentage of customers who book their follow-up service before leaving your facility.
- Measure declined-work recovery rate to identify how many customers accept recommended services they initially rejected or postponed.
- Conduct weekly parts pricing audits to find quick-win items like wipers and batteries that drive revenue gains without much effort.
Then round out your scorecard with these labor and technician benchmarks:
- Set labor sales growth targets through routine maintenance services, pushing technicians to recommend oil changes, filter replacements, and fluid flushes consistently.
- Create benchmarks for technician proficiency by tracking hours per repair order and labor absorption rates against historical performance data.
- Compare customer pay effective labor rate against warranty and internal labor rates to spot pricing gaps that cost you money.
- Display overall effective labor rate trends on your digital signage so technicians and managers see progress toward targets in real time.
- Prioritize internal reconditioning efforts for used inventory, setting specific labor hour goals that boost internal labor sales and absorption rates.
Once these measurable goals anchor your operation, live data transforms how your team closes performance gaps and executes daily.
How to use data to close performance gaps?
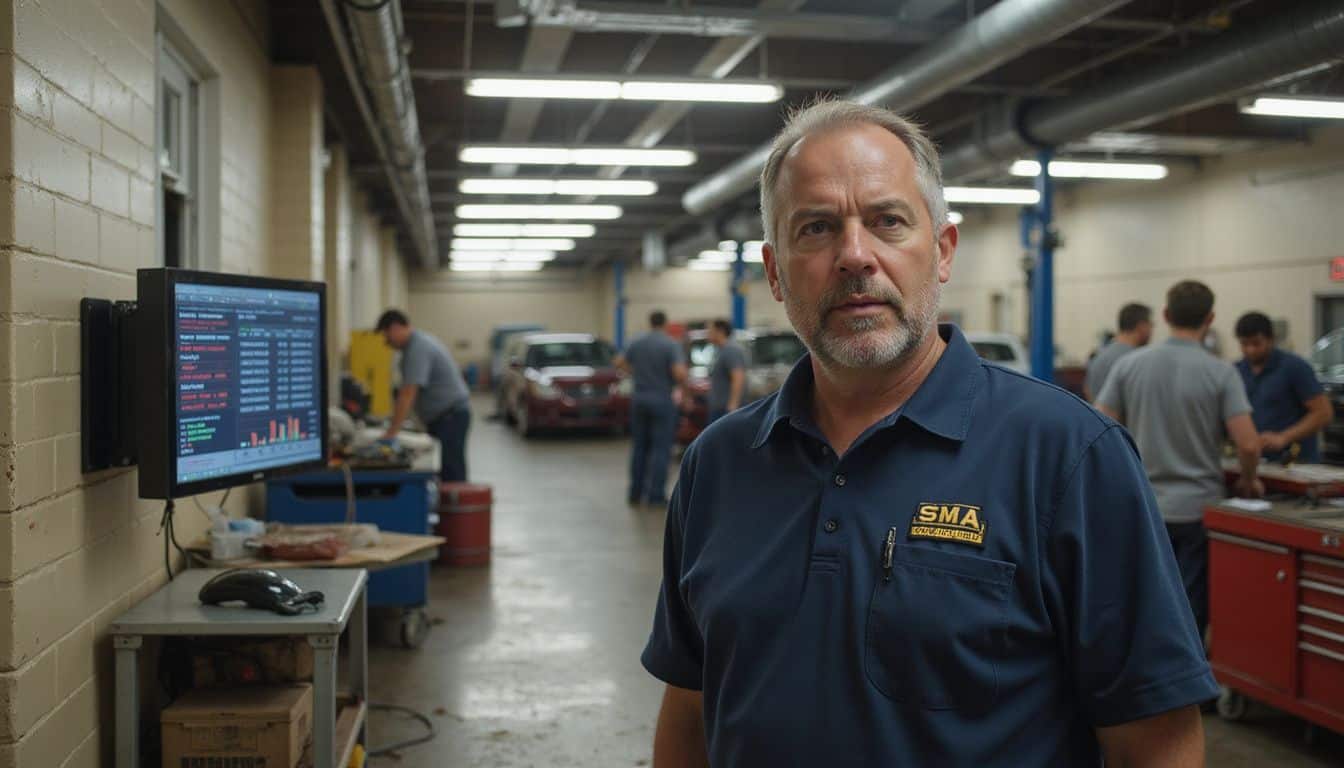
Your digital signage displays real-time data that reveals exactly where your fixed operations fall short. Data transforms your service department from guessing to knowing.
- Pull weekly audit reports and compare your effective labor rate across customer pay, warranty, and internal categories against local independent shops to spot pricing gaps immediately.
- Track appointment flow against technician capacity each week. If hours sold lag behind available slots, your scheduling system is leaving money on the table.
- Review parts gross and aging inventory monthly to catch slow-moving stock before obsolescence drains your margins and creates service delays.
- Spot-check internal repair orders for billing accuracy and approval compliance, since internal RO leakage quietly kills absorption rates without you realizing it. A spot audit of 60 internal repair orders over 30 days found that 22% contained unapplied labor hours, averaging 0.9 hours per affected RO at a shop rate of $95 per hour. Scaling that sample suggested monthly leakage of $12,500 in unbilled labor, and another 18% of ROs had incorrect pay-type coding that skewed ELR calculations. A fixed ops controller reviewing the audit noted that a quick check like this shows why small billing errors compound into real monthly losses, and that live boards would have flagged the gap sooner.
Keep the momentum going with these follow-up actions:
- Display labor sales capacity metrics on your service boards so technicians see real-time hour targets. Visibility drives accountability and closes the gap between potential and actual output.
- Analyze your work type balance by comparing customer pay versus warranty versus internal jobs. Imbalanced workloads signal where you need to adjust pricing or sales strategy.
- Monitor effective labor rate discipline weekly to prevent technician discounting that erodes gross profit per repair order. Your digital signage should flag rate deviations instantly.
- Synchronize technician shifts with peak appointment times using live data, matching staffing to demand so you capture capacity you currently lose during busy periods.
- Adjust service prices based on manufacturer cost increases, and identify categories where aggressive pricing attracts price-sensitive customers without sacrificing margin.
How to train staff to effectively use live tracking?
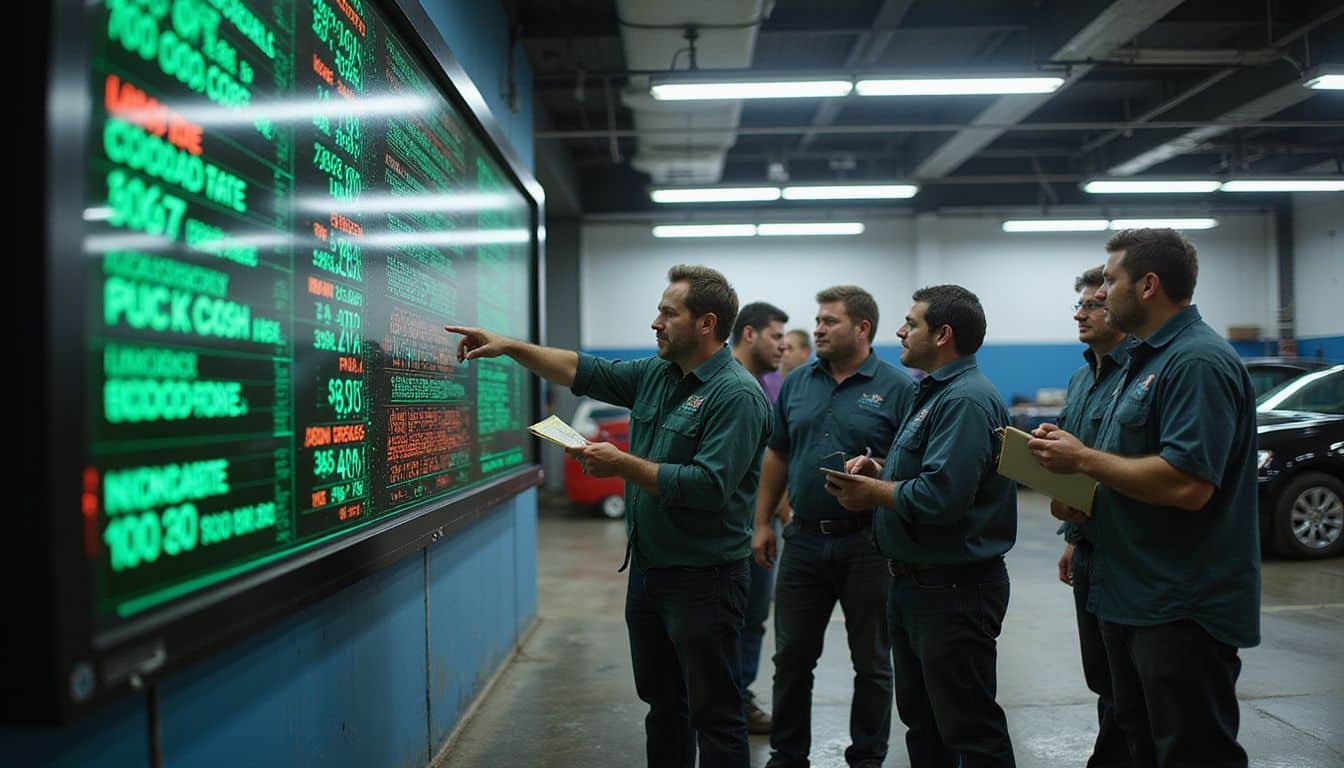
Staff adoption makes or breaks your live tracking system. Without proper training, your team leaves money on the table and misses chances to boost absorption rates.
Focus first on mindset and skill:
- Start with a mindset shift that positions service as the beginning of the customer relationship, not the end. Your advisors need to see every service visit as a chance to capture trade-in inventory and build long-term loyalty.
- Show service advisors how their role goes beyond processing work orders into active sales engagement. Selling a vehicle is just the starting point for customer value.
- Teach advisors to read inspection results and connect them directly to service package offerings. When technicians flag issues, advisors present solutions that match what customers actually need.
- Create clear internal policies and require approval for any exceptions to standard rates. This prevents mis-coding, write-downs, and confusion from varying internal charges across your team.
Then reinforce good habits with consistent coaching and recognition:
- Use your digital signage boards to display real-time metrics that matter, like technician productivity, service gross profit per repair order, and absorption targets, so everyone on the line can see them.
- Coach managers to maintain consistent processes even during rush periods. Busy days are exactly when shortcuts happen, so reinforce discipline through coaching rather than hoping staff remembers training.
- Run monthly training sessions focused on menu presentation and package clarity. Advisors who confidently explain what customers are getting drive higher attachment rates and satisfaction.
- Track which advisors close more sales and have them mentor peers. Peer-to-peer learning works better than direct instruction for changing behavior in automotive sales environments.
- Celebrate wins on your tracking boards when teams hit absorption targets. Recognition reinforces the behaviors you want repeated month after month.
Conclusion

Your dealership has the power to turn fixed operations into a profit engine, one that covers overhead and builds real stability.
Live target-tracking boards give you the visibility to spot performance gaps fast and close them faster. They also keep your whole team aligned on what matters most.
When technicians see their productivity metrics in real time, they work smarter. When service and sales share the same goals, customers win and your service absorption rate climbs.
Top dealers hit 100% absorption by pairing solid benchmarks with transparent tracking, so overhead gets covered before the first vehicle even sells. Start today. Set measurable goals, train your team on the tools you already have, and watch fixed operations become the financial foundation that keeps your dealership strong through any market shift.
FAQs
1. What is a fixed operations absorption rate, and why does it matter?
It’s the percentage of your dealership’s fixed costs covered by service, parts, and body shop income. Don Reed of DealerPro Training says dealers aiming for 100% or higher can fund their overhead without relying on vehicle sales. Track this number closely, and you’ll run a tighter, more profitable shop.
2. How do live target-tracking boards help car dealers?
They give you real-time visibility into daily performance instead of waiting for month-end reports. Jim Collins called this the flywheel effect in Good to Great, and these boards keep it spinning by showing your team daily progress.
3. Can better absorption rates offset a slowdown in pre-owned inventory sales?
Yes, they can. Cox Automotive reports that service departments maintain stability through market swings, giving you steady income and strong expense control even when pre-owned inventory sales slow down.
4. Do brands like Ford, Honda, GM, Tesla, or Rivian affect absorption rate strategies?
Not really. Whether you sell Ford, Honda, GM, Tesla, or Rivian vehicles, the fixed ops formula stays the same, though EVs and trucks have different maintenance schedules that affect how you track productivity.
5. What’s the fastest way to start improving absorption rates?
Start small by setting up a simple tracking board and updating it daily. CBT News has covered dealers who saw quick wins just from making performance visible, because once everyone sees the numbers, expense control follows naturally.