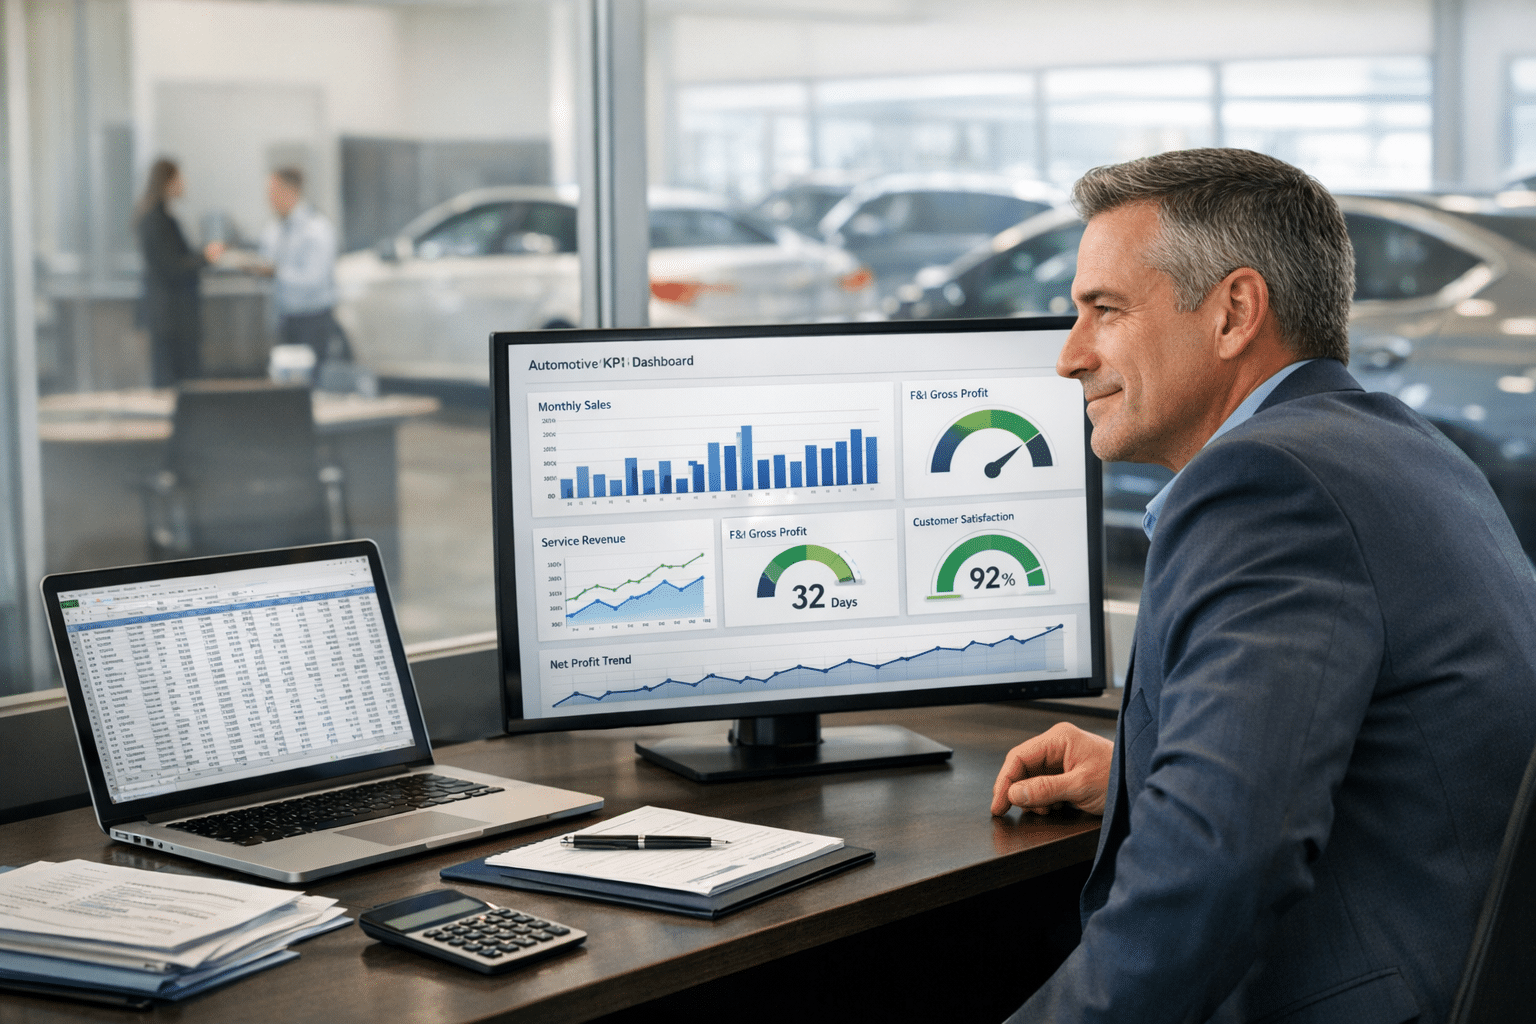
Many dealership CFOs still lean on Excel spreadsheets to track key performance indicators, or KPIs. Manual work slows things down and invites mistakes. Numbers go stale fast, which can hide problems and delay fixes.
One point is clear: automated dealership KPI dashboards give realtime data and quick financial analytics. These tools turn raw data into clear reporting that supports faster, smarter calls. That is the edge leaders need in a busy store.
This article compares Excel spreadsheets with modern dashboard solutions. It also shows how automation makes metric tracking easier, and how platforms like Digital Dealership System lift business intelligence for any size dealer. Want a sharper view of financial performance? Keep reading.
Key Takeaways
- Automated dealership KPI dashboards stream realtime data and cut manual errors. Excel depends on slow updates and hand entry, which increases risk.
- Dashboards raise operational efficiency for CFOs with automated reporting. Many teams save hours each week compared to building Excel workbooks.
- Live data connections improve accuracy and let CFOs track sales, service, and finance without spreadsheet delays.
- Customizable visuals make trends easy to see and act on. Excel’s basic charts make pattern spotting harder and slower.
- Shifting from Excel to automated KPI dashboards like Digital Dealership System improves business intelligence and response speed in today’s dealership market.
What are the drawbacks of using Excel for tracking dealership KPIs?
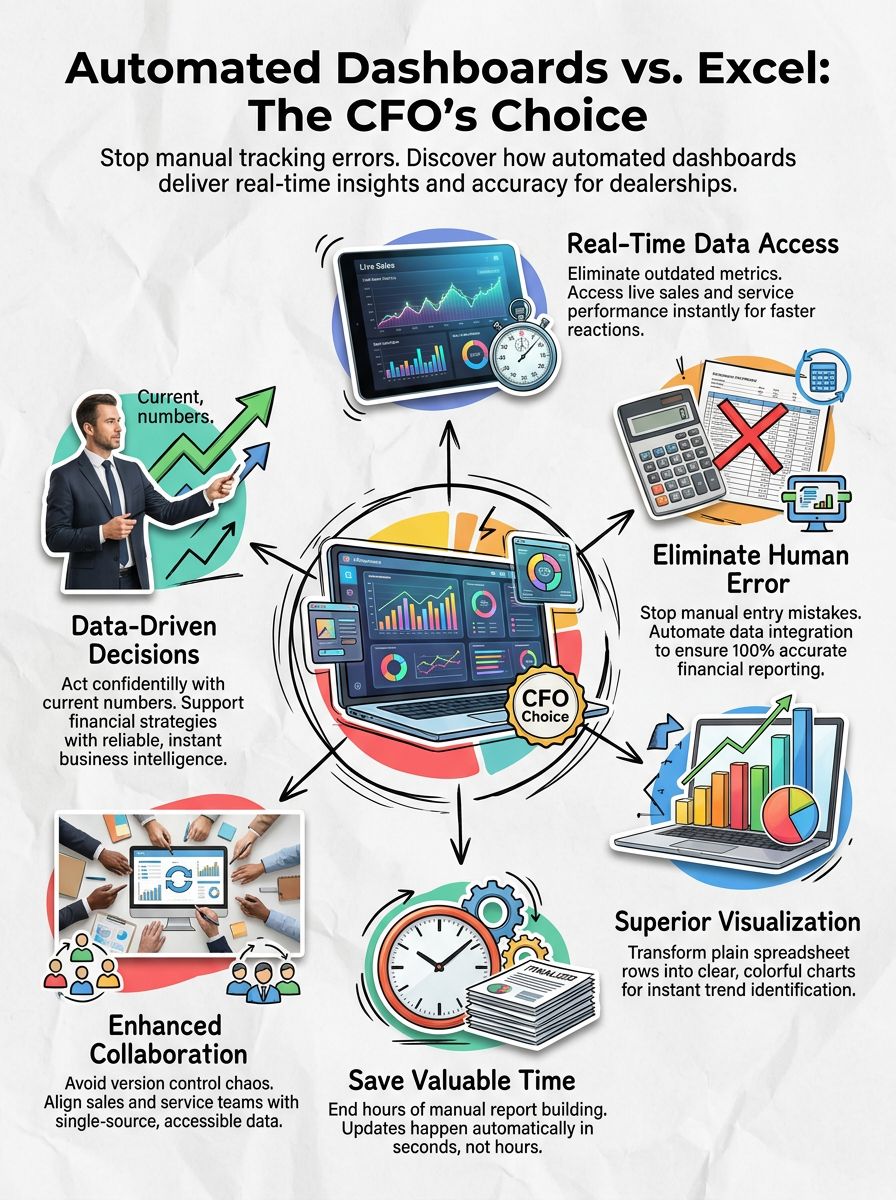
Excel does not refresh in realtime, so teams often review yesterday’s numbers. That lag can hide sudden dips in gross, turns, or lead response time. Decisions made on old data can cost money.
Manual entry is another risk. Typos, copy and paste errors, and broken formulas add up. Confidence in reports drops, and audits take longer.
Excel’s data visualization is limited compared to modern analytics tools. Building useful dashboards takes time and advanced skills many staff do not have. Even simple changes can break a worksheet.
Collaboration is hard too. If multiple people share files, version control gets messy fast. Teams waste time asking which file is current.
Data management becomes painful when pulling figures from many sources into one file. The process is slow and easy to miss. Excel also lacks built-in alerts. No automated warnings fire when KPIs cross a line, unless someone checks the sheet by hand.
A single wrong value entered in a rush can cost hours of correction down the line.
For CFOs who need automation, clean data integration, and trustworthy performance measurement, Excel falls short.
What benefits do automated dealership KPI dashboards offer?
Automated dashboards fix these pain points with realtime insights. Every department sees current results by the minute. Sales leaders track open deals as they move. Service managers watch customer satisfaction scores and act fast on dips.
Custom dashboards display key metrics on digital signage in the showroom or service lanes. Teams see targets, progress, and results at a glance. That visibility builds focus and speed.
Automation lifts operational efficiency for single-point stores and groups. Staff leaderboards spotlight top performance without extra data entry. Marketing results, sales funnels, and finance metrics live in one place with fewer errors.
Setup is handled by experts so each dashboard fits the store’s process. Updates connect to decision support systems, so leaders make calls with current numbers, not last week’s exports. Work moves faster, data gets clearer, and teams align on the same truth.
Ready to modernize reporting? Explore custom automated dashboards today.
Key differences between Excel and automated dashboards for CFOs
These differences shape financial performance and decision support. The right choice helps leaders track metrics with less noise and more speed.
How does data accuracy compare between Excel and automated dashboards?
Automated dashboards improve accuracy by pulling data directly from source systems. Fewer manual steps mean fewer errors. Broken links and outdated files are far less common.
With live integrations, data stays current across all performance indicators. CFOs can check gross, days to turn, service ROs, and marketing cost per lead without hunting through folders. Clear visuals reduce misreads that come with long rows of numbers.
Accurate insights are ready when needed. There is no need to recheck every cell or worry that reports are stale.
What are the time-saving advantages of automated dashboards over Excel?
Realtime analytics remove delays. Teams no longer enter figures by hand or chase updates, which trims errors and speeds up reporting. Dashboards refresh in seconds, so maintenance drops and value rises.
Leaderboards and prebuilt visuals replace hours of manual report building. That time can shift to analysis and action. Customization is quick, and pro installation lowers the burden on staff.
These time wins free CFOs to focus on strategy and coaching instead of spreadsheet upkeep.
How do automated dashboards improve decision-making for CFOs compared to Excel?
Dashboards give CFOs a live view of KPIs. Faster access to realtime data improves decisions, while Excel reports often arrive late. Dashboards combine feeds from many sources into one screen for a complete picture.
Color-coded charts and trend lines turn data into clear insights. Fewer manual entries mean fewer mistakes and more trust in the numbers. CFOs can build views for sales, service, or finance goals at scale, which is hard to do in Excel.
Connections with apps and databases keep every metric current. That saves time and lifts operational efficiency across the store. To lift business intelligence, automated dashboards are a practical next step.
Conclusion
Moving from Excel documents to automated dealership KPI dashboards helps CFOs make faster and smarter choices. Realtime data, clean financial metrics, and strong reporting tools reduce manual work and raise confidence.
Performance dashboards from Digital Dealership System give leaders accurate insights any time, without digging through scattered spreadsheets. That shift improves analytics and delivers true business intelligence when it matters most.
Get ahead of the competition with data automation. See how dashboards can raise sales, service performance, and customer satisfaction. For a walkthrough, contact the Digital Dealership System team or visit their website. This content is for general information and is not financial advice.
FAQs
1. What are the main differences between using Excel DOC and automated dealership KPI dashboards for CFOs?
Excel spreadsheets offer manual data entry, which can lead to errors and time-consuming updates. Automated dealership KPI dashboards provide real-time analytics, seamless integration with DMS systems, and instant access to key performance indicators. This shift means faster decision-making and fewer mistakes.
2. How do automated KPI dashboards improve efficiency compared to traditional Excel documents?
Automated dashboards update metrics automatically from your dealership’s core databases. You avoid repetitive manual work, reduce human error risk, and gain immediate insights into sales trends or inventory levels. These tools let you focus on strategy instead of chasing numbers.
3. Why should a dealership CFO consider switching from Excel DOC to an automated dashboard solution?
Switching gives you accurate reporting without delays or version confusion common in shared spreadsheets. Automated solutions highlight profit opportunities quickly; they also help spot operational issues before they grow costly. Your team spends less time compiling reports and more time acting on reliable data.
4. Are there security or compliance benefits when using automated dealership KPI dashboards over Excel files?
Yes, modern dashboard platforms use advanced encryption protocols that protect sensitive financial information better than standard spreadsheet files stored locally or emailed around the office. Audit trails track every change made within the system; this supports regulatory compliance while building trust with stakeholders who demand transparency at every step.
For tailored advice about upgrading your reporting process, contact our expert consultants today… Discover how streamlined analytics can transform your finance operations!