Waiting in the service lane can feel slow, even when the clock says otherwise. Many drivers wonder why five minutes feels like fifteen. Average Wait Time Perception vs Actual Wait Time in the Service Lane explains this gap, and why it affects mood, trust, and repeat visits.
Researchers call this perception bias. It means the mind guesses time based on cues, not just seconds on a timer. A quiet lobby, no updates, or unclear next steps can stretch a short wait into a long one in a customer’s head.
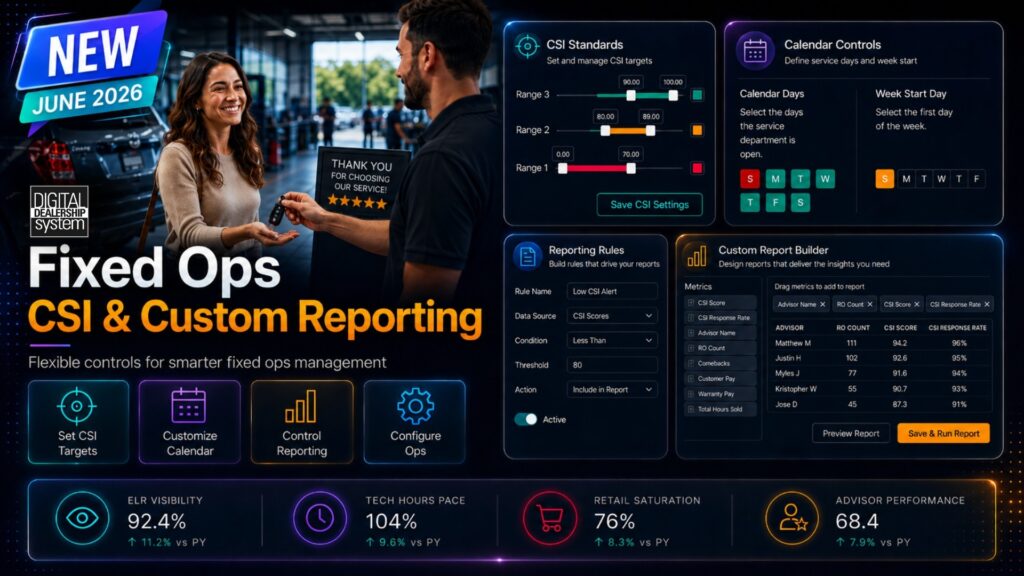
This article breaks down the causes and shows what dealerships can do right now. It also covers simple tools like real-time KPI dashboards, short for key performance indicator boards, from Digital Dealership System. Clear updates, friendly signs, and honest timing can turn wait time into a better customer experience.
Key Takeaways
- Customers often overestimate service-lane waits because of limited updates, unclear steps, and perception bias.
- Digital Dealership System tools, such as live KPI dashboards and lobby screens, cut perceived wait time with real-time status and queue positions.
- Transparency about waits and progress improves satisfaction more than shaving a few minutes off the actual time.
- Shops that use real-time analytics, staff scoreboards, and quick feedback stations see better operations and more return visits.
- Managing both feelings and facts with digital tools builds trust, keeps customers loyal, and supports service sales.

Understanding the Difference Between Perceived and Actual Wait Times
The clock shows one number. Feelings often show another. That gap shapes customer experience and service efficiency in every lane.
What causes the difference between perceived and actual wait times?
Several human factors shape how long a wait seems. Distraction, stress, and unclear expectations can stretch time in the mind. A quiet room with no updates makes minutes feel slow.
Clear, steady communication shortens the perceived wait. A quick status check, a text message, or a screen with an estimated finish time gives people control. Even small delays feel shorter when the next step is known.
How do customers estimate their wait times in the service lane?
Most people guess based on the last visit, what they see now, and how busy the lane looks. If last week’s oil change took 30 minutes, they expect the same today. A long line or still vehicles can push that estimate higher.
Real-time KPI dashboards and digital signs make those guesses smarter. These tools share current averages and show each car’s place in line. Digital Dealership System displays help set fair expectations before stress builds.
In-store messages and simple explanations calm nerves fast. “Providing real-time updates keeps customers informed every step of the way.” With clear numbers and plain language, guests feel more confident staying for repair or maintenance.
Factors Influencing Wait Time Perception in the Service Lane
Small cues shape time perception. A busy shop can feel fast if the process is visible and friendly.
What factors affect how customers perceive wait times?
Perception drives satisfaction and the chance a customer returns. These factors matter most:
- Digital signage with real-time updates sets clear timing and cuts guesswork.
- Transparent KPI dashboards show progress, which makes waits feel shorter.
- A comfortable space with visible activity keeps eyes off the clock.
- Helpful in-store messages hold attention and lower frustration.
- Real-time analytics flag slowdowns so leaders can fix them quickly.
- Personalized solutions let each shop address its own customer needs.
- Expectations, shaped by past visits or local word of mouth, set patience levels.
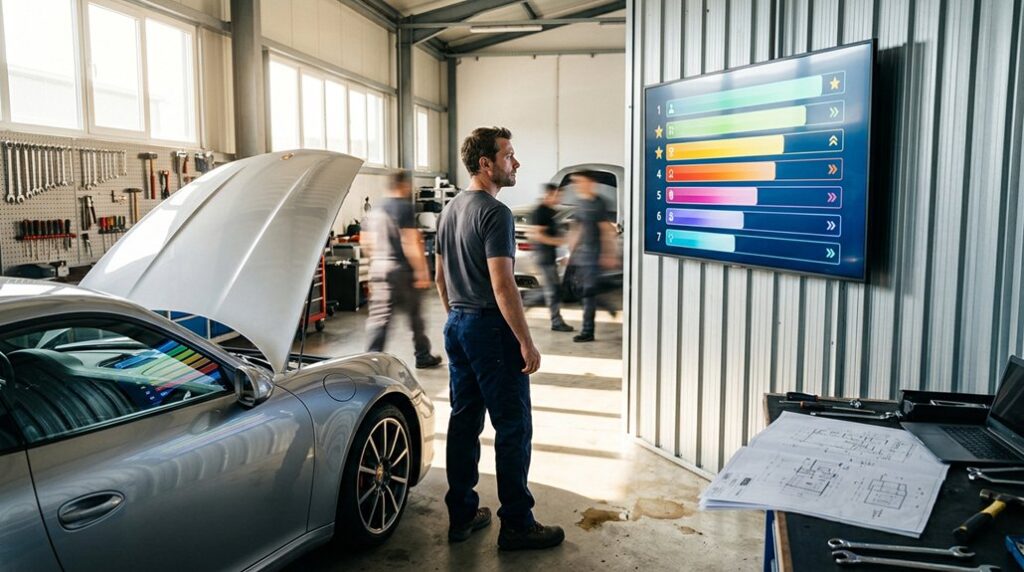
- Staff scoreboards encourage faster, friendlier service that trims true delays.
- Simple step-by-step communication turns confusion into calm.
- Shared performance metrics align what guests feel with what is real.
How does the service environment impact wait time perception?
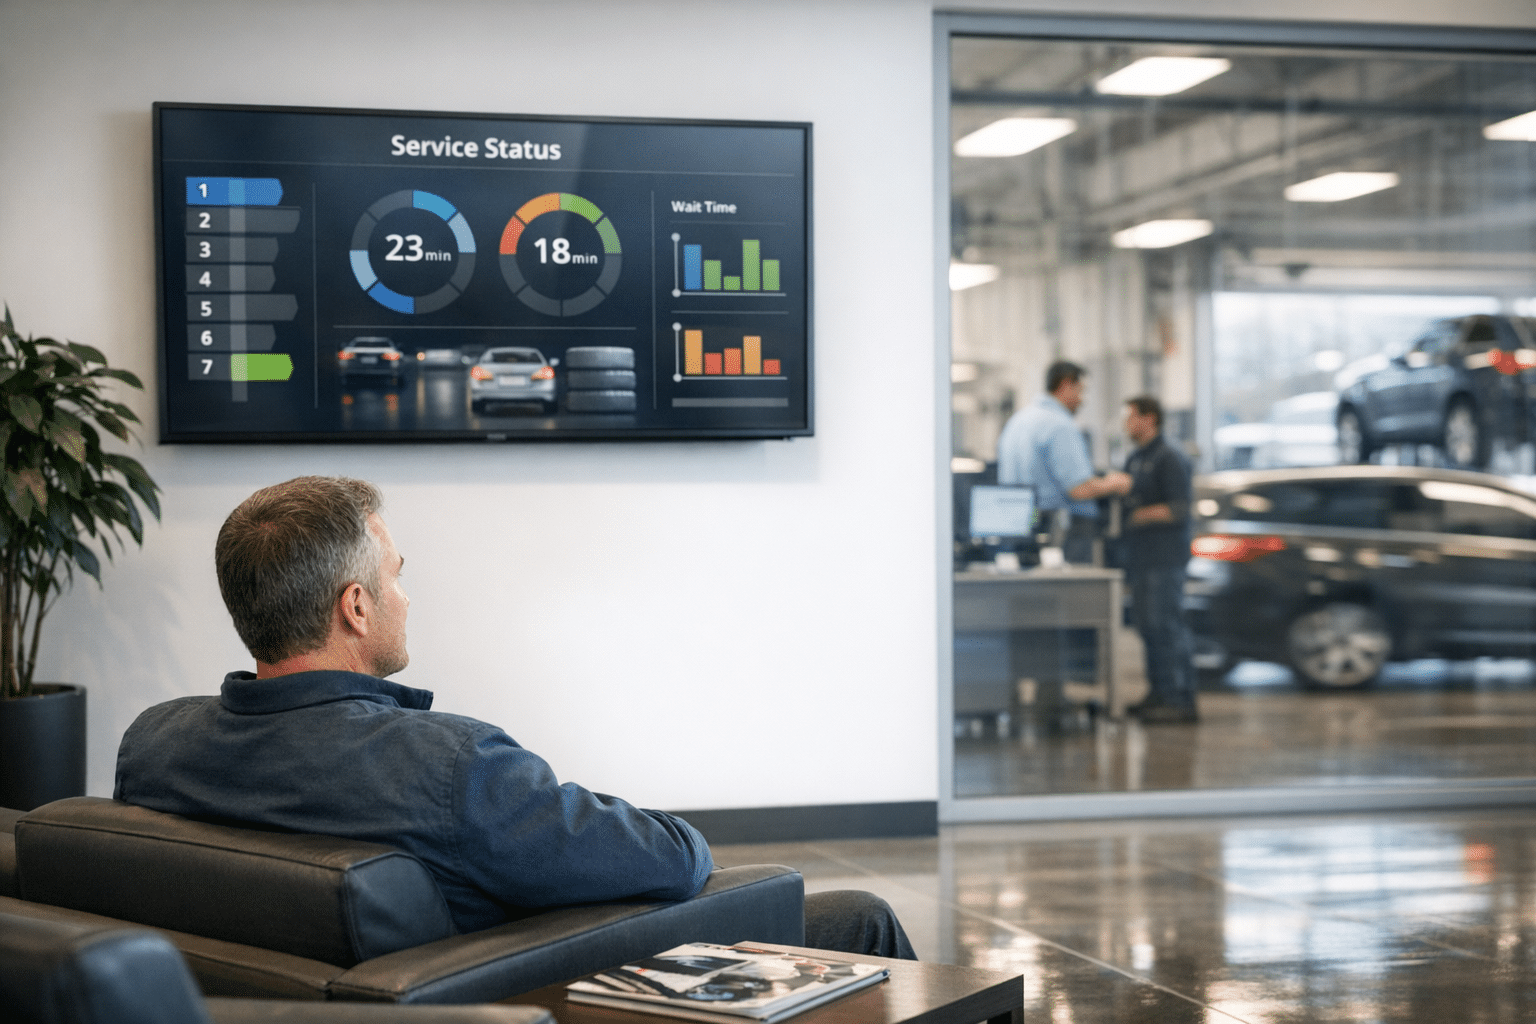
The environment sets the tone for time. Visual tools like digital signage and KPI dashboards keep people informed and engaged while they wait.
These screens show repair status and queue dynamics, which makes each minute feel shorter and fair. With Digital Dealership System displays, many stores see higher satisfaction even when actual timing does not change.
As one customer shared:
“Seeing my car’s progress up on the screen made me forget about watching the clock.”
Friendly staff, a clean lobby, and clear digital updates turn a routine wait into a solid experience. These small touches work together and pay off quickly.
Impact of Wait Time Perception on Customer Satisfaction
How a wait feels can outweigh how long it is. Managing perception and facts side by side helps every score go up.
How does perceived wait time influence customer satisfaction?
Customers judge value based on how the wait felt. If time seemed fair and the line kept moving, people report higher satisfaction. The clock might say 40 minutes, but steady updates can make it feel like 25.
Missed expectations do real damage. If a quick visit turns into silence and delay, trust drops fast. Calm spaces, progress notes, and honest timing raise satisfaction, even during peak demand.
What can service lanes do to improve customer satisfaction despite wait times?
Busy hours happen. Smart steps keep customers informed and upbeat while work gets done.
- Use a Digital Dealership System dashboard to share live progress and timing in plain view.
- Run digital signs in the lobby with queue updates, FAQs, and helpful tips about services.
- Motivate teams with scoreboards built around speed and friendly updates.
- Choose solutions that fit the size of the store, from single-bay shops to large centers.
- Share timely offers on screens to turn idle time into value for guests.
- Train staff to give short, proactive updates, even during delays.
- Add a simple station where guests can explore services or book the next visit.
- Collect quick feedback on digital kiosks, then fix pain points fast.
Conclusion
Clear, real-time information closes the gap between perception and truth. Average Wait Time Perception vs Actual Wait Time in the Service Lane shapes satisfaction, loyalty, and word of mouth.
Digital Dealership System brings timing, queue positions, and progress to the front of the house. Their KPI dashboards and digital signage help teams manage expectations and keep guests informed. With better wait time analysis, shops lift service quality and improve sales, one clear update at a time.
Want to see these results in your service lane? Visit Digital Dealership System to explore proven tools that boost service efficiency and customer experience.
FAQs
1. Why do customers often feel like the wait time in the service lane is longer than it actually is?
Customers tend to overestimate how long they have waited due to uncertainty, lack of updates, or discomfort during their visit. This perception can differ from actual measured times, especially if distractions are limited or expectations are not managed.
2. How does understanding average wait time perception versus actual wait time help improve customer satisfaction?
Recognizing this gap allows service providers to communicate more clearly and set realistic expectations. When clients know what to expect and receive regular updates, their experience feels smoother and trust increases.
3. What strategies can reduce negative perceptions about waiting in a service lane?
Clear communication about expected timelines, comfortable waiting areas with amenities, and frequent status updates all help minimize frustration. These steps show respect for your client’s time while highlighting your commitment to quality care.
4. Can accurate tracking of real wait times benefit my business operations?
Yes; precise data on actual wait durations helps identify bottlenecks and optimize staffing levels for peak periods. Sharing these improvements with clients builds confidence in your process—call us today or visit our website to see how we streamline every step for you!