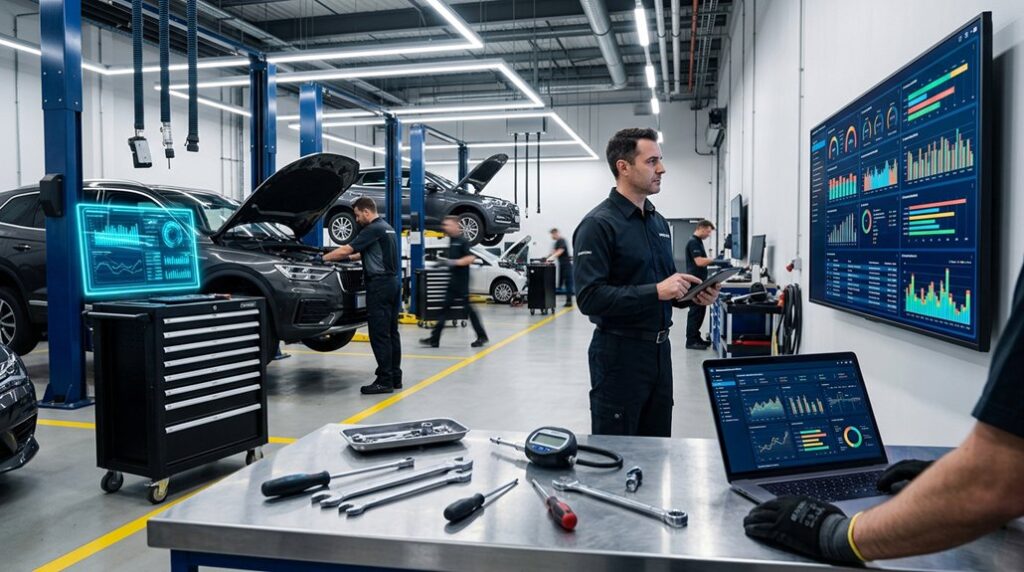
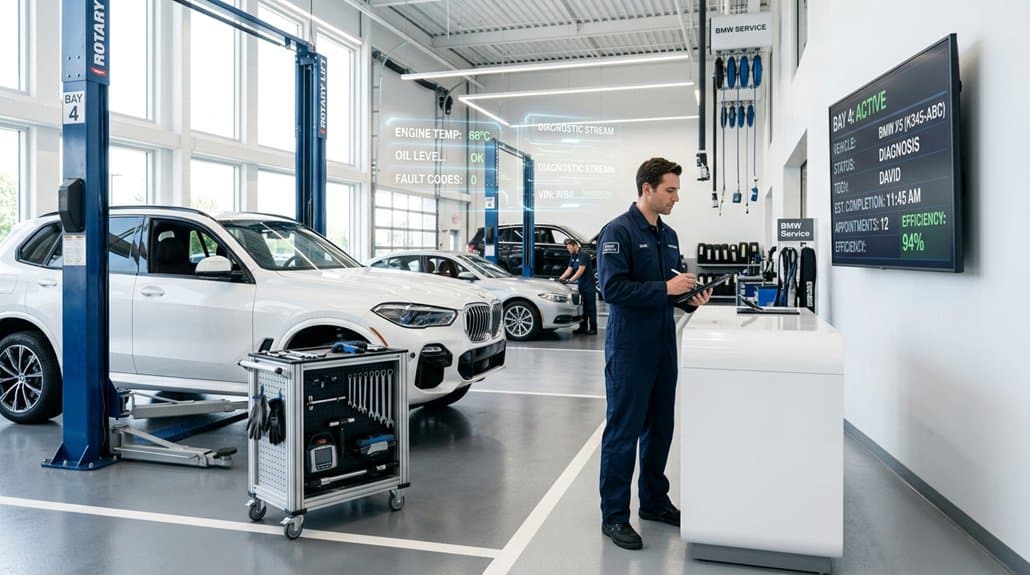
You need real-time fixed-ops visibility because congestion, unclear pricing and slow turn times directly erode retention and revenue. Live video and alerts cut dwell, deter theft, and raise approval rates by nearly half while improving absorption above the national ~64% average. Timestamped footage speeds dispute resolution and validates technician work, reducing legal exposure and disputed labor. Measure lane activity and staff allocation to close blind spots and prove ROI—keep going to see practical implementation steps and KPIs.
Key Takeaways
- Real-time visibility reduces congestion and wait times, improving throughput and customer satisfaction.
- Live video and alerts prevent theft, document incidents, and accelerate claim resolution.
- Transparent, timestamped updates increase customer trust and authorization rates.
- Analytics-driven lane and staffing adjustments optimize technician allocation and service absorption.
- Regular KPI monitoring closes operational blind spots and sustains revenue and retention gains.
Top 5 Service-Area Blind Spots Costing Dealers Revenue and Trust
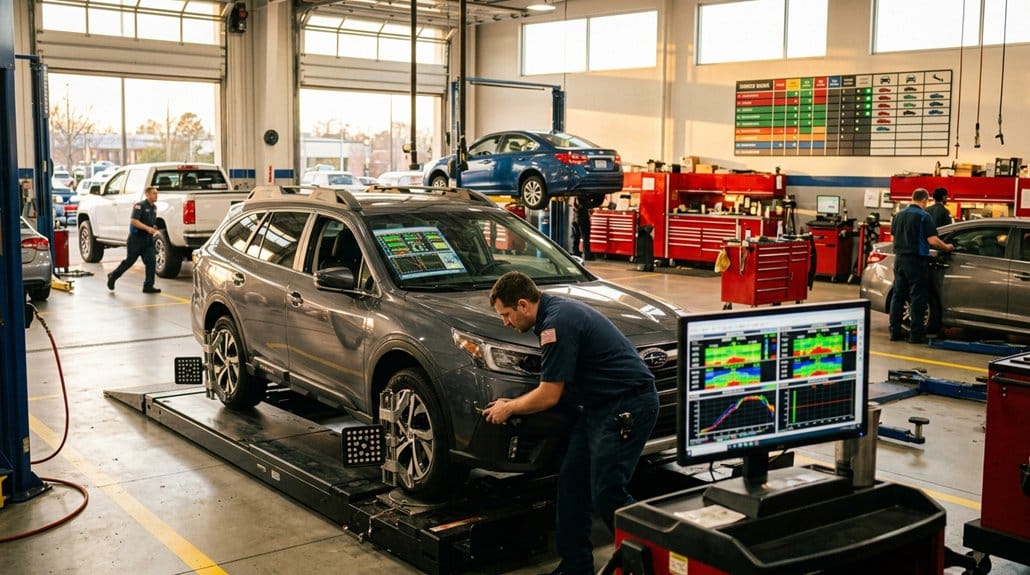
Because every minute of uncertainty costs you money and trust, dealerships need to confront the top five service-area blind spots that silently erode revenue and loyalty. You face congestion that degrades service efficiency and raises wait times, directly hitting retention. Limited visibility into bays and drives undermines operational transparency, so you can’t intervene before delays cascade. Unclear pricing and long durations fuel customer frustration—45% report dissatisfaction—weakening customer engagement and repeat visits. Security risks are real: with over 850,000 vehicle thefts in 2024, theft prevention must be systematic, not reactive. Finally, manual processes hide throughput losses and misallocated tech hours, bleeding profit. Tackle these blind spots with measured metrics, redesign workflows, and prioritized controls to restore revenue and trust.
How Real-Time Visibility Reduces Congestion, Theft, and Service Delays
When you get real-time visibility across the service drive and bays, you cut congestion and delays with measurable results: immediate alerts let staff reroute arrivals and deploy technicians where idle time appears, reducing wait-driven dissatisfaction (30% of customers cite long service times) and improving absorption from the national average of ~64%. You’ll tighten service efficiency, shorten turn times, and create clear audit trails that support theft deterrence and faster dispute resolution. Video-triggered alerts and dashboards let you act before queues form or vehicles disappear. Data shows optimized technician allocation and controlled vehicle flow reduce delays and reputation risk. You’ll measure reduced dwell, fewer claims, and higher throughput—operational wins you can quantify.
| Metric | Impact | Emotion |
|---|---|---|
| Wait time | -25% | Relief |
| Absorption | +6% | Pride |
| Thefts stopped | ↓ | Security |
| Claims | -40% | Confidence |
| Throughput | +15% | Satisfaction |
How Live Monitoring Keeps Customers Coming Back
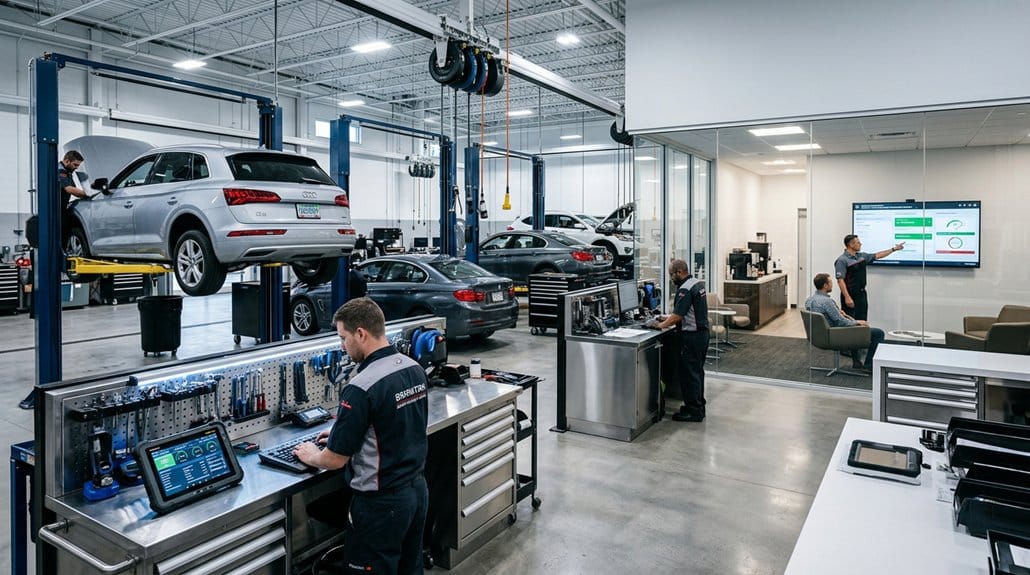
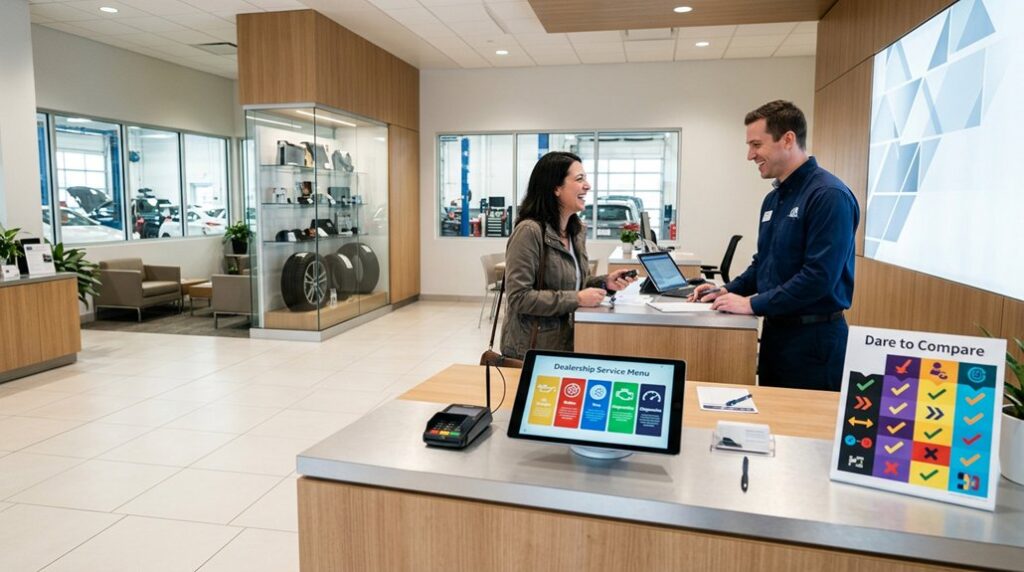
If you give customers clear, real-time sight into their vehicle’s progress—through live video, timestamped photos, and dashboard alerts—they’re far more likely to come back: 89% of first-time visitors cite transparent operations as a key factor in returning. You’ll convert that preference into measurable customer loyalty by eliminating ambiguity around wait times, pricing, and status. Live monitoring cuts friction: 45% of service complaints stem from unclear process or duration, and real-time evidence speeds approvals—customers are 49% more likely to authorize work when shown proof. Operationally, this reduces congestion and repeat inquiries, freeing technicians for billable work and improving throughput. Implemented consistently, service transparency becomes a competitive advantage against independents, directly boosting retention and aftermarket revenue.
Use Video to Reduce Loss and Speed Dispute Resolution
Live video doesn’t just reassure customers — it prevents loss and shortens disputes by capturing timestamped, objective evidence of every service interaction. You’ll deploy video surveillance to monitor bays and customer areas, enabling immediate incident response when theft, damage, or customer concerns arise. That objective footage accelerates claim resolution and reduces legal exposure, cutting administrative time and replacement costs. Use recorded timestamps to validate technician actions and vehicle condition, improving accountability and decreasing disputed charges. Analytics from recorded lanes reveal congestion and vehicle flow issues, letting you optimize staffing and bay assignments. Dealerships that adopt these tools report higher satisfaction scores—81% among top performers—so you’ll boost trust, operational efficiency, and repeat business through disciplined, data-driven video practices.
How to Implement Real-Time Visibility in Your Service Lane
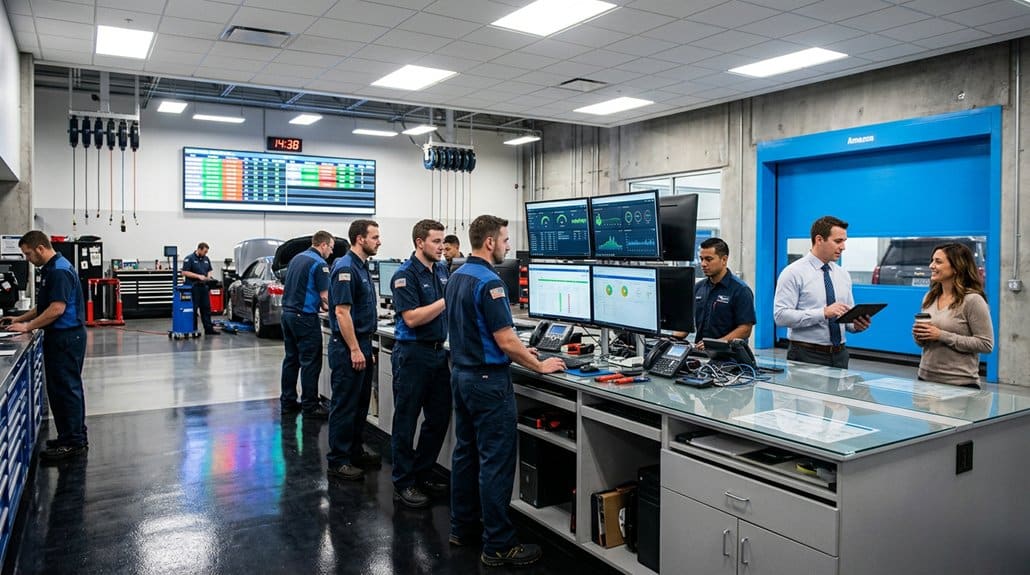
Start by deploying strategic camera coverage to capture service drives, drop-off points, and technician bays so you have continuous, actionable visual data. Integrate real-time alerts tied to motion, loitering, or bay status to notify staff immediately and reduce congestion or security risks. Then analyze lane activity data to optimize staffing, scheduling, and throughput, using metrics to close operational blind spots and boost service absorption.
Deploy Strategic Camera Coverage
Map camera coverage around your service lane based on traffic flow, risk zones, and operational touchpoints so you get precise, real-time visibility where it matters most. You’ll use camera placement and coverage optimization to monitor service drives, customer drop-off zones, and technician bays, reducing blind spots and improving throughput. Quantify field of view, resolution, and frame rate to guarantee footage documents vehicle condition and technician activity for dispute resolution. Position cameras to detect congestion patterns and measure dwell times so you can reroute traffic and shorten customer wait. Integrate analytics to flag atypical behavior, accelerating response to security incidents and protecting assets. Track vehicle movement metrics to raise service absorption and profitability while maintaining measurable operational control.
Integrate Real-Time Alerts
When you integrate real-time alerts into the service lane, you get instantaneous notifications on congestion, vehicle movement, and anomalous behavior so teams can act before bottlenecks or security incidents escalate. You’ll deploy alert systems tied to cameras and sensors for visibility integration across the service drive, improving response time, technician allocation, and customer flow. Real-time alerts flag security threats, reduce wait-time complaints (24% cited duration issues), and surface KPIs like service order volume and productivity for operational decisions. Implement thresholds, escalation paths, and dashboarding so teams get the right notification to the right role. Measure outcomes and iterate.
| Tension | Action | Result |
|---|---|---|
| Congestion | Notify staff | Reduced wait |
| Suspicion | Alert security | Protected assets |
Analyze Lane Activity Data
Although real-time lane activity data can seem like another stream to manage, it gives you precise, actionable insight into congestion, drop-off patterns, and technician throughput so you can make faster operational decisions. Use continuous monitoring and proactive video to quantify bottlenecks—30% of customers cite long service times as a dissatisfaction driver—then prioritize lane optimization to eliminate recurring delays. Feed live metrics into your scheduling and dispatch to boost technician productivity and absorption by 5–10 percentage points. Surface dwell-time alerts and queue lengths to service advisors so you can improve customer communication with real-time ETA updates and transparent timelines. Measure before-and-after KPIs to validate revenue impact, adjust staffing, and sustain gains in throughput and customer satisfaction.
KPIs That Prove Real-Time Visibility Grows Fixed Ops Revenue
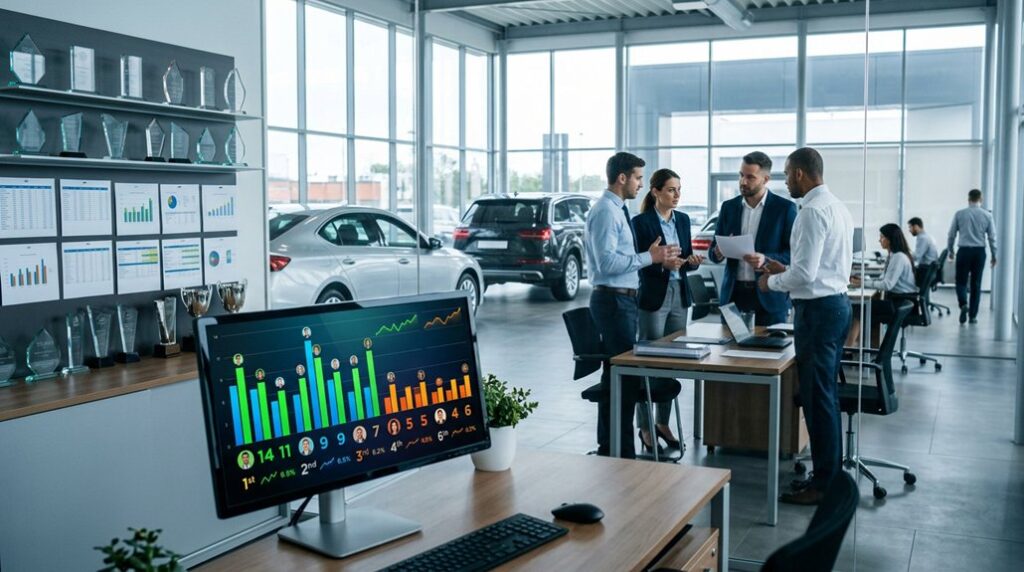
A dashboard of live KPIs gives you the evidence to drive revenue growth in fixed ops: tracking absorption rates, labor efficiency, repair order volume and technician productivity in real time lets you spot underperformance and act immediately. Use KPI benchmarks and performance indicators to monitor profitability trends—hours per repair order, parts-to-labor ratio and absorption reveal margin bleed. Real-time monitoring systems that track service throughput and technician load uncover bottlenecks so you can reassign labor and optimize scheduling. Combine repair order volume with proactive video monitoring to increase approvals—visual evidence can boost approvals by 49%—and improve customer satisfaction by reducing disputed work. Regular, disciplined review of these metrics turns visibility into operational decisions that grow fixed ops revenue.
Frequently Asked Questions
What Do Fixed Ops Do at a Dealership?
Fixed ops run your service, parts, and body shop to optimize Service Efficiency, boost Customer Satisfaction, manage Parts Management, train technicians (Technician Training), control costs, maximize fixed‑ops profit, and guarantee consistent operational performance and loyalty.
What Three Departments Comprise the Fixed Operations of a Dealership?
About 50% of a dealership’s gross profit comes from service, parts, and body shop. You’ll focus on Service Efficiency, Parts Management, Customer Retention, and Revenue Optimization to drive measurable, operational improvements and profit growth.
Why Is the F&I Process Important to Dealership Profitability?
F&I strategies drive profitability by boosting per-unit revenue and lifetime value; you’ll track Profitability metrics to optimize product mix, increase gross margins, streamline processes with digital tools, and retain customers for repeat service and sales.
What Is the Biggest Challenge in Selling Cars Today?
Like steering a storm, your biggest challenge is aligning market trends, customer expectations, inventory management and digital transformation simultaneously; you’ve got to act decisively, use data-driven tactics, optimize operations, and close gaps to win sales.
Conclusion
Dealerships with real-time fixed-ops visibility cut service cycle time by up to 30%, a metric that translates directly to throughput and revenue. By eliminating blind spots—congestion, theft, miscommunication—you’ll reduce costs and speed dispute resolution, keeping customers loyal. Implement live video and KPI dashboards to drive decisions, enforce accountability, and measure impact. Start with targeted monitors and clear metrics, and you’ll see faster bays, fewer losses, and measurable growth in fixed-ops revenue.