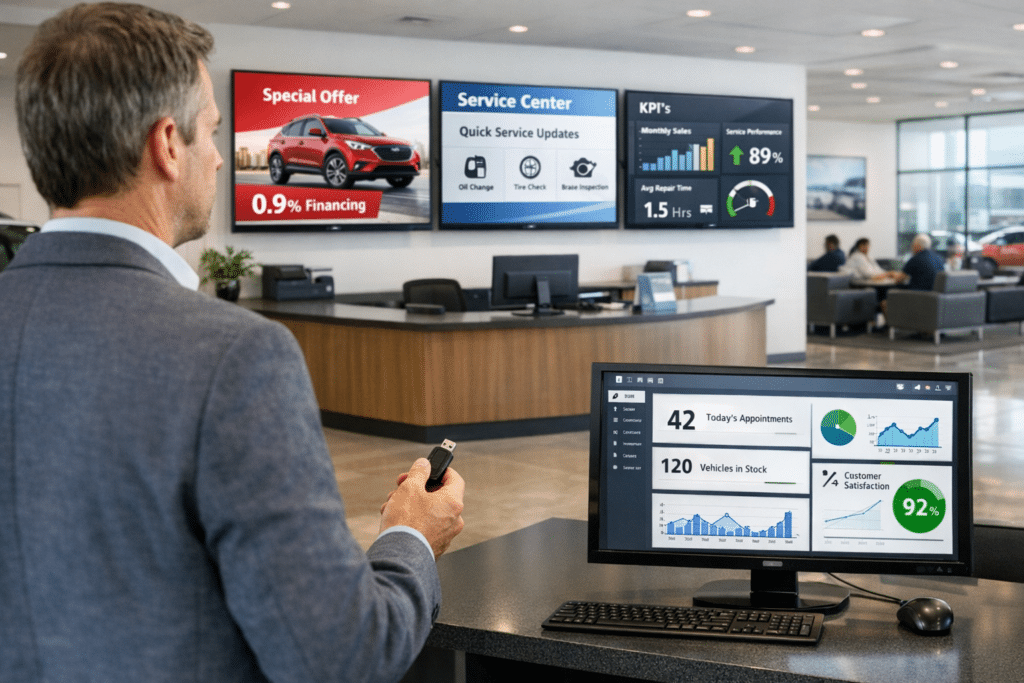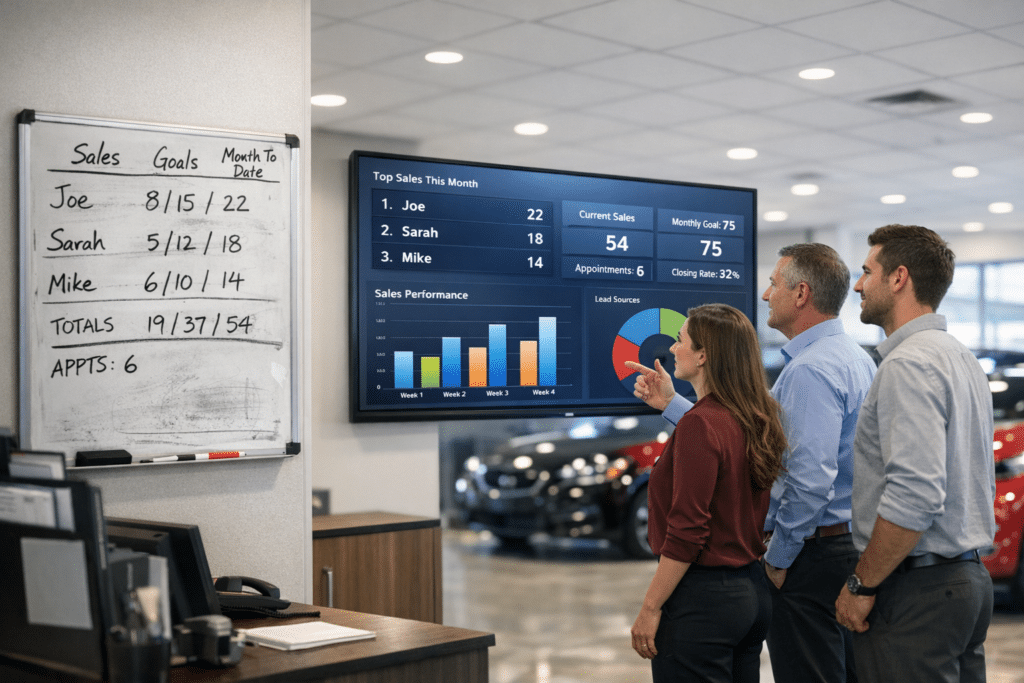

You’ll drive more service revenue with live fixed‑ops leaderboards because they turn hours of manual reporting into real‑time KPI visibility, automated alerts, and mobile dashboards that boost technician productivity and RO value. Immediate data helps you reallocate capacity, flag waste, and prioritize high‑value repairs so throughput and absorption improve fast. You’ll cut admin time, lift advisor performance, and recognize top performers to reduce churn—keep going to see the rollout, KPIs, and quick wins that make it work.
Key Takeaways
- Real-time KPIs let managers act instantly on opportunities, turning delays into additional ROs and revenue.
- Live dashboards eliminate hours of manual reporting, freeing time to focus on revenue-driving activities.
- Continuous visibility boosts technician productivity and throughput through competition and immediate feedback.
- Automated alerts and capacity data prioritize high-value repairs and reduce downtime, increasing billable hours.
- Visible performance recognition and coaching decrease churn and improve absorption, lifting monthly service revenue.
How Live Leaderboards Drive Fixed-Ops Revenue
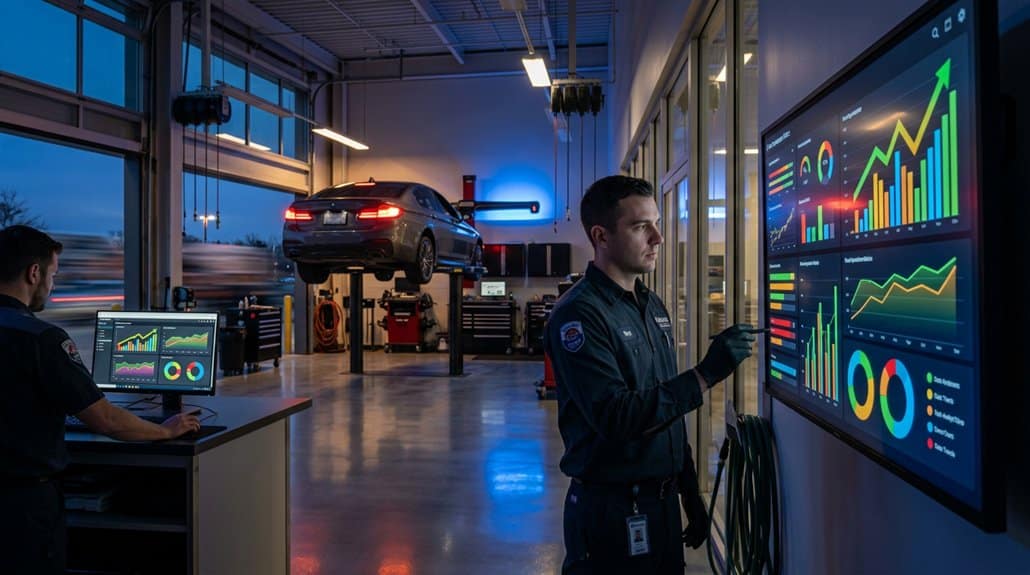
Harness real-time insights to boost fixed-ops revenue: live leaderboards pull data from multiple sources so you can spot technician productivity gaps, customer-satisfaction drops, and workflow bottlenecks instantly instead of waiting hours for manual reports. You’ll reclaim up to six hours weekly by eliminating manual reporting, reallocating that time to customer engagement and strategic tasks that drive revenue optimization. With immediate performance benchmarks, service advisors tweak pricing, upsell tactics, and scheduling in real time, translating small gains—like a $15 lift per RO—into roughly $1,500 monthly revenue increases. Transparency creates accountability, aligning incentives with measurable KPIs and motivating teams to hit targets. The result: faster, data-driven decisions, fewer bottlenecks, higher technician throughput, and sustained service revenue growth.
How Live Leaderboards Work: Data, Alerts, and Integrations
Because real-time decisions depend on timely data, live fixed-ops leaderboards pull continuous feeds from dealership management systems, telematics, and external sources (like weather and traffic) to give you up-to-the-minute views of technician productivity, RO status, and workflow bottlenecks. You get data visualization and performance metrics that replace manual reports, saving ~30 minutes daily and up to six hours weekly. Alert customization and real-time feedback let you intervene before delays compound. Integration strategies tie external factors into scheduling logic. Mobile accessibility guarantees teams have decision-making tools on the floor or remotely. Focus on user engagement through clear KPIs and concise dashboards to drive adoption and faster responses.
| Feature | Benefit |
|---|---|
| Data feeds | Immediate insight |
| Alerts | Proactive fixes |
| External data | Delay forecasts |
| Mobile | Anywhere access |
| Dashboards | Clear KPIs |
Track Performance in Real Time to Raise Throughput and RO Value
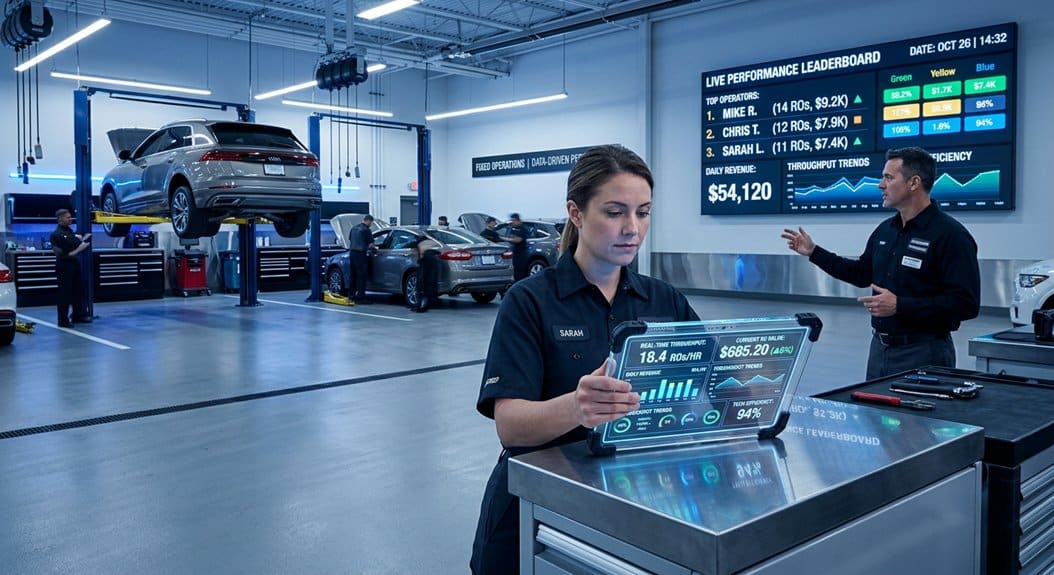
Having real-time leaderboards feeding your team means you can move from monitoring to measurable improvement: instant access to technician productivity and RO status cuts reporting from six hours a week to seconds, so you can spot bottlenecks and act immediately. You’ll use real time tracking and performance metrics to drive throughput and RO value: advisors see RO opportunities, technicians compete on clear KPIs, and managers redirect capacity instantly. Data shows a 30% efficiency lift when teams have continuous visibility and a $15 uptick per RO can add roughly $1,500 monthly. Focus your actions on where the numbers point.
- Monitor technician productivity minute-by-minute.
- Surface stalled ROs to reassign workload.
- Track average RO value and conversion rates.
- Benchmark teams with live performance metrics.
Cut Waste and Costs With Automated Alerts and Capacity Visibility
With real-time capacity visibility you’ll see technician availability and utilization instantly, so you can allocate labor hours to maximize throughput. Automated waste alerts flag missed opportunities and service gaps that typically eat into daily productivity, cutting manual reporting time by up to 30 minutes. Prioritized repair scheduling then turns those insights into action—reducing downtime, boosting service revenue, and lowering operational costs.
Real-Time Capacity Visibility
When you can see technician availability and workload in real time, you cut bottlenecks and boost efficiency by up to 30%, while automated alerts flag capacity issues before they waste labor hours. You get immediate capacity optimization: dashboards replace 30 minutes of daily manual reporting, freeing staff to improve throughput and customer service. Integrating weather and traffic data helps anticipate delays and reallocate resources proactively. Continuous visibility drives technician engagement by making performance metrics transparent and actionable, creating accountability that raises productivity and satisfaction.
- Monitor live technician load to prevent overbooking.
- Use dashboards to reassign work and reduce idle time.
- Combine external data (weather/traffic) for smarter scheduling.
- Track KPIs in real time to sustain gains and inform strategy.
Automated Waste Alerts
One clear lever to cut costs is automated waste alerts that notify you in real time about inefficiencies—so you can stop losing labor hours to avoidable delays and idle bays. You’ll get immediate, data-driven notifications that pinpoint bottlenecks, drive waste reduction, and enable faster corrective action. Alert systems tied to capacity visibility let you staff to demand, cut idle time, and boost technician productivity. Studies show up to 20% lower operational costs when you adopt automated alerts, improving margins and service revenue. These alerts increase accountability with measurable performance metrics so managers can prioritize interventions and continuous improvement. Use live leaderboards and alert systems together to turn visibility into consistent operational gains.
| Metric | Alert Type | Impact |
|---|---|---|
| Idle Bays | Delay Alert | Reduced labor waste |
| Throughput | Bottleneck Alert | Faster cycle time |
| Staffing | Capacity Alert | Optimized scheduling |
Prioritized Repair Scheduling
Although prioritizing repair work can feel chaotic, automated alerts and capacity-aware leaderboards make scheduling surgical: they surface urgent jobs, flag upcoming deadlines, and match tasks to available technicians in real time so you cut customer wait times, eliminate idle bays, and drive labor utilization that can boost monthly revenue by well over $100,000.
You get real-time urgent job prioritization and technician workload management, reducing manual lag and identifying bottlenecks instantly. Data-driven leaderboards show capacity by bay and skill, so you reassign work to avoid overtime and missed SLAs. Automated alerts prompt advisors before deadlines, improving retention and throughput.
- Surface urgent jobs with priority scoring and SLA reminders.
- Visualize technician capacity to rebalance shifts and tasks.
- Detect bottlenecks via live throughput metrics.
- Reduce idle time and increase billable hours quickly.
Build Accountability and Retention With Transparent, Floor-Level Metrics
Because live fixed ops leaderboards put real-time KPIs right on the shop floor, you get instant transparency that drives accountability and retention—technician efficiency and repair order counts become visible targets, managers can spot trends and coach underperformers immediately, and advisors make smarter decisions that boost customer loyalty (return customers are 74% more likely to buy their next vehicle from you). You’ll build an accountability culture where staff see goals and outcomes every shift, reducing ambiguity and improving consistency. Visible metrics enable timely coaching and structured performance recognition, which cuts churn and lifts productivity. With potential upside of roughly $1,500 per technician monthly from performance gains, transparent leaderboards align incentives, streamline communication, and let you act on problems before they erode revenue.
Rollout Checklist and Quick Wins: Timeline, KPIs, and Training
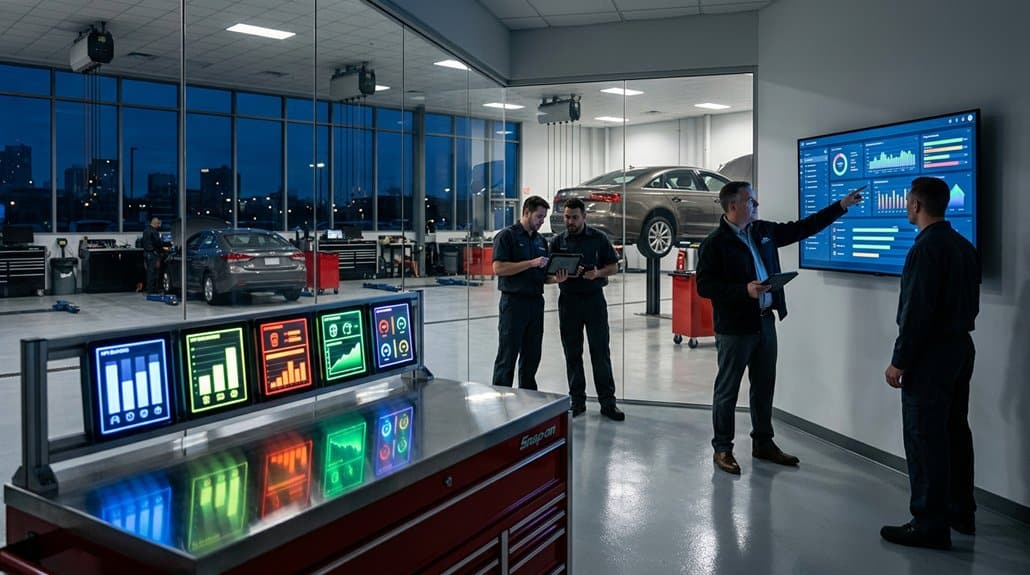
You’ll map rollout milestones on a 30–60 day timeline to deliver dashboards, integrations, and pilot sign-offs. Set KPIs like technician productivity, labor efficiency, and customer satisfaction with clear targets and reporting cadence. Provide a brief training plan focused on hands-on sessions and weekly adoption checks to secure immediate time savings and continuous improvement.
Rollout Timeline Milestones
Start with a 30–60 day rollout plan that breaks the implementation into weekly milestones: define rollout phases and anticipate implementation challenges up front so you stay on schedule. Focus on measurable quick wins, training priorities, and a feedback mechanism to iterate.
- Week 1–2: Data mapping, baseline metrics, and addressing integration implementation challenges; aim for 20% faster report generation.
- Week 3–4: Pilot dashboards with core users; deliver focused training to boost adoption up to 40% and capture initial feedback.
- Week 5–6: Expand access, refine views based on feedback, and validate technician productivity and service revenue tracking.
- Week 7–8: Full deployment, continuous feedback loop, and handoff to operations with documented processes and KPI review cadence.
KPI Setup And Targets
A clear KPI framework will make it easy to measure progress and prioritize actions during rollout. You’ll define KPIs—effective labor rate, hours per RO, customer satisfaction—and map them to business outcomes. Use KPI alignment strategies to connect each metric to absorption and profit goals; set initial targets from historical baselines aiming for a 5–10% absorption improvement to capture potential >$100k monthly upside. Implement targets on a structured timeline: month one for baseline and training, quarterly assessments thereafter. Apply target adjustment techniques based on early dashboard signals and quick wins (reduced wait times, better follow-up) to recalibrate targets pragmatically. Track progress continuously, prioritize interventions by ROI, and iterate targets to sustain momentum without overcorrecting.
Training Plan And Adoption
Because adoption determines ROI, your rollout should pair a phased 30–60 day timeline with targeted training, KPI checkpoints, and rapid feedback loops to drive quick wins. You’ll phase pilots, expand to full staff, and measure training effectiveness against baseline KPIs (technician productivity, appointment scheduling efficiency, CSAT). Hands-on workshops teach advisors and techs to interpret live leaderboard data and adjust workflows immediately. Create a tight feedback loop to capture usability issues and improve staff engagement. Expect measurable booking and workflow gains in month one; use those quick wins to build momentum and justify further investment.
- Week 0–2: pilot, baseline KPIs, focused workshops.
- Week 3–4: iterate, collect feedback, adjust training.
- Week 5–6: scale, monitor productivity, CSAT.
- Ongoing: cadence reviews, retrain, report training effectiveness.
Frequently Asked Questions
Are High Priced High Profit Dealer Services That Add Little or No Value to a Car?
Yes — you’ll see high‑priced, high‑profit services often add little real value; promoting service transparency boosts customer trust, improves value perception, and lets you use smarter pricing strategies to retain business and reduce aftermarket loss.
Conclusion
You’re not guessing in the dark anymore — you’ve got a live dashboard that’s as precise as a lighthouse beam. With real-time alerts, integrations, and floor-level metrics, you’ll tighten throughput, cut waste, and lift RO value with measurable gains. Rollouts become predictable sprints: track KPIs, train quickly, and watch retention and accountability rise. Like swapping a map for GPS, you’ll move from manual reports to data-driven decisions that reliably boost fixed-ops revenue.