You’re wasting time on static fixed‑ops reports that update slowly and deliver stale snapshots, so they don’t create urgency or actionable coaching cues. Live leaderboards refresh every 15 minutes, show real‑time KPIs like ROs, efficiency, and CSI, and trigger immediate corrections via peer comparison and instant feedback. That continuous visibility shifts behavior, boosts productivity and retention, and turns small per‑RO gains into meaningful revenue — keep going to see how to implement it quickly.
Key Takeaways
- Static fixed-ops reports provide stale snapshots, delaying insights and diminishing urgency for immediate corrective action.
- Manual report upkeep consumes 30 minutes daily, diverting managers from coaching and frontline engagement.
- Historical figures lack real-time feedback, so teams miss instant reinforcement that drives behavior change.
- Static visuals and infrequent updates fail to create peer-driven competition and momentum that boost productivity.
- Without mobile, 15-minute refreshes and clear goal visuals, dashboards don’t translate KPIs into timely, actionable coaching.
Why Static Fixed‑Ops Reports Don’t Motivate Teams
Because static fixed‑ops reports update slowly and demand about 30 minutes of admin time daily, they fail to drive the rapid, accountable behavior you need on the floor. You’re left with stale snapshots that undermine static engagement and blunt performance tracking — teams see historical figures, not actionable moments. That lag eliminates urgency: technicians and advisors don’t get the instant feedback that prompts course correction or friendly competition. Administrative overhead diverts attention from coaching and improvement, so leaders can’t reinforce behaviors in real time. Without visible, current rankings or refreshable metrics, accountability slips and motivation wanes. If you want measurable gains, you need tools that reduce admin time, surface live metrics, and convert data into immediate, trackable actions.
How Live Leaderboards Change Behavior on the Service Lane
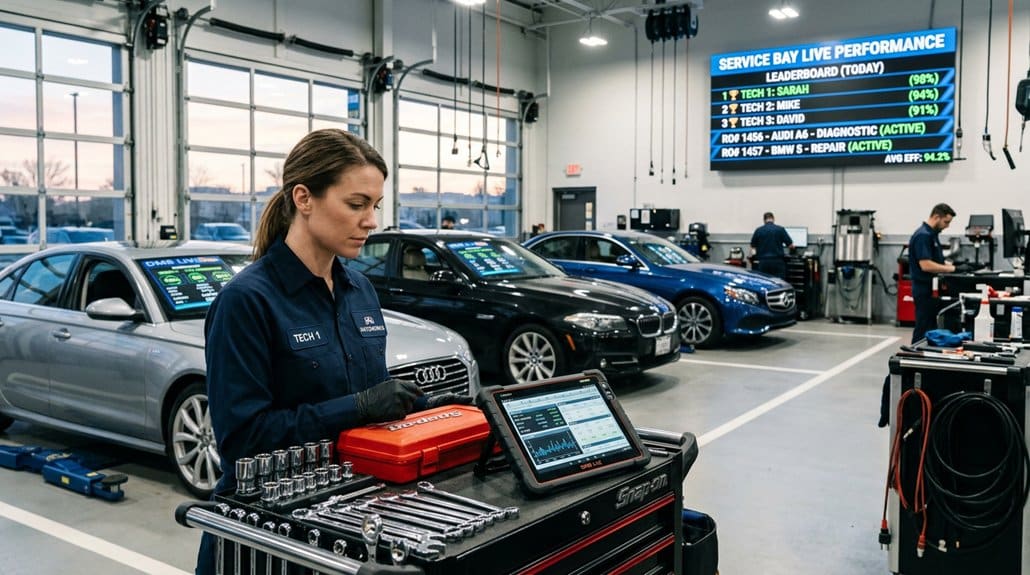
When you get real-time performance nudges every 15 minutes, you’re able to correct course immediately instead of waiting for end-of-day reports. Seeing peer comparisons on digital boards or your mobile device creates measurable shifts in behavior—efficiency and sales climb as people respond to visible benchmarks. That instant feedback loop turns individual actions into team momentum, boosting productivity and service profitability.
Real-Time Performance Nudges
Although static reports can leave you reacting to yesterday’s problems, live leaderboards put real-time performance nudges right in the service lane, showing ROs, hours, and efficiency so advisors and techs can adjust tactics instantly. You get performance engagement through instant feedback: metrics update continuously, prompting immediate actions—rebalancing workload, pushing upsells, or reallocating tech hours. That instant feedback loop closes the gap static reports leave open, turning missed opportunities into on-the-spot improvements. Accountability rises because data is visible and timely, and studies tie leaderboards to better morale and productivity. Deploying live nudges shifts behavior from passive to proactive, creating measurable gains in throughput, utilization, and customer satisfaction.
| Metric | Impact |
|---|---|
| ROs | Increased throughput |
| Efficiency | Higher utilization |
Visible Peer Comparison
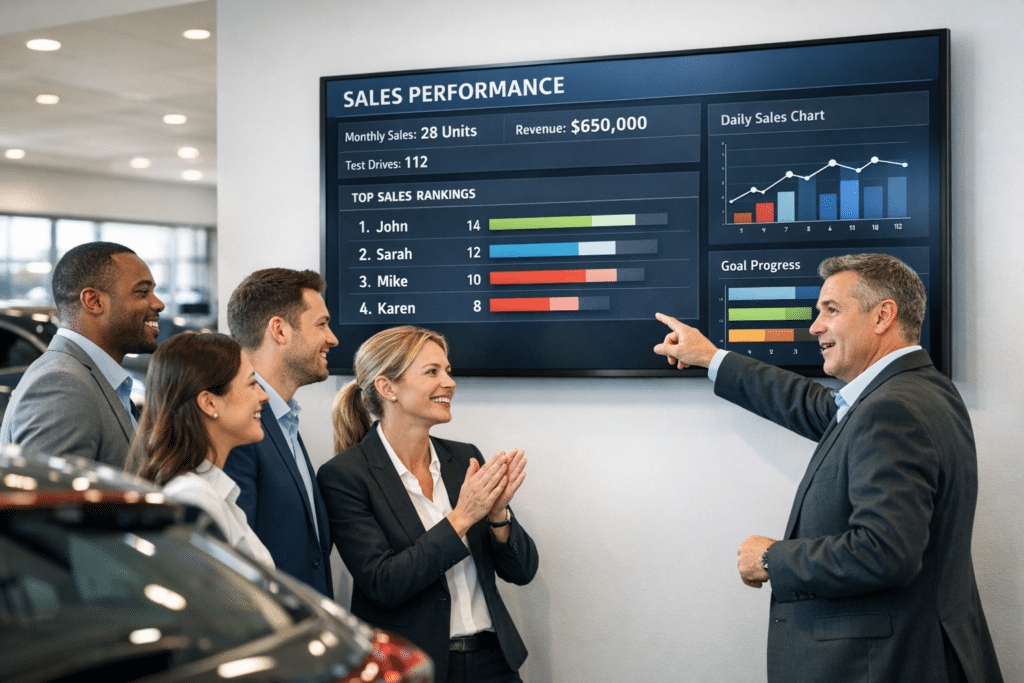
Live leaderboards don’t just give instant nudges—they surface how each advisor and tech stacks up against peers, turning abstract goals into visible benchmarks you can act on. You see real-time metrics—ROs, efficiency, throughput—so peer engagement shifts from anecdote to measurable behavior. That transparency sparks a competitive spirit that’s productive: people push for higher rankings, not from pressure but from clear targets and visible progress. Immediate feedback flags top performers for recognition and underperformers for focused coaching, so managers allocate training where it actually moves the needle. Research shows digital leaderboards raise accountability and engagement, converting static reports into actionable insights. In short, visible peer comparison creates a data-driven feedback loop that lifts individual and team performance.
KPIs Live Leaderboards Surface (That Static Reports Miss)
Because leaderboards refresh every 15 minutes, you get real-time visibility into ROs, hours, efficiency, effective labor rate, and CSI—metrics static reports usually show too late to act on. That KPI importance matters because Metric visibility drives faster Performance tracking and immediate Data driven decisions. You’ll spot a dip in effective labor rate or CSI and course-correct within the same shift, rather than after a weekly review. Live feeds fuel Engagement strategies by activating Competitive spirit: technicians and advisors respond to visible rankings and short-term targets. That transparency enforces Accountability measures while promoting Team collaboration on bottlenecks, staffing, or training needs. In short, leaderboards convert delayed reports into actionable insights that directly boost productivity and morale.
Dashboard Design That Gets Advisors and Techs to Act
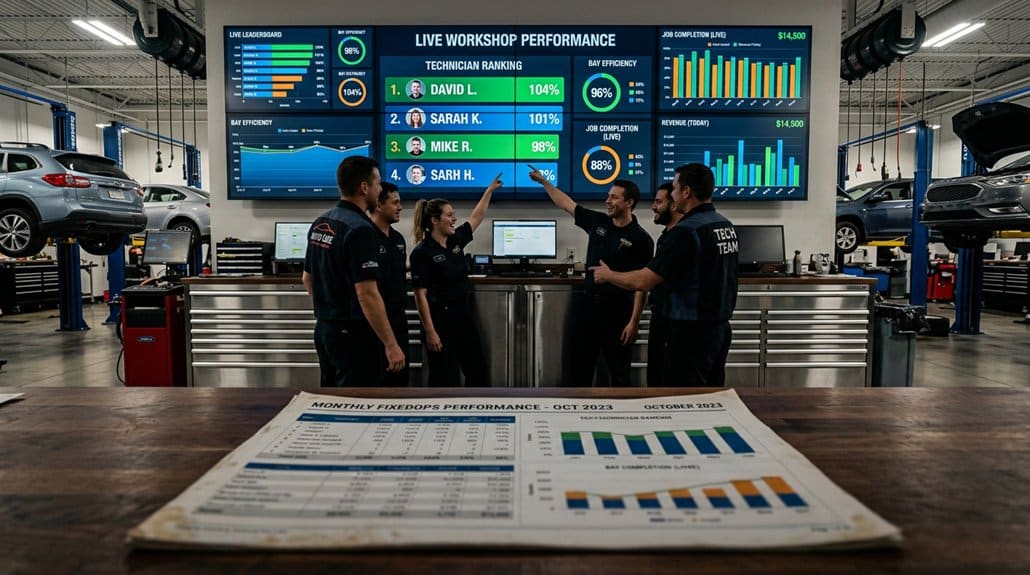
You need dashboards that put real-time, actionable metrics — like ROs, efficiency, and effective labor rate — front and center so advisors and techs can correct course within the 15-minute update window. Use clear, goal-oriented visuals (targets, progress bars, and rank) that make gaps and priorities obvious at a glance. With mobile access and live data, those visuals turn visibility into measurable behavior change and faster revenue impact.
Real-Time Actionable Metrics
If dashboards update every 15 minutes and show clear KPIs like hours sold and effective labor rate, advisors and techs will spot gaps and act immediately rather than waiting for end-of-day reports. You’ll get real time engagement because live leaderboards surface performance tracking in the moment, turning passive reports into prompts for action. Visual, actionable metrics let teams seize upsell opportunities and recover lost hours before they compound.
- See: concise KPIs update frequently so you recognize shortfalls fast.
- React: immediate visibility drives behavior—people adjust schedules, pitch services, or reallocate tasks.
- Measure: continuous feedback holds staff accountable and shows impact on gross per RO.
The result is faster decision-making and measurable revenue upside.
Clear Goal-Oriented Visuals
When dashboards show concise, goal-oriented visuals that update every 15 minutes, advisors and techs can instantly see where they stand on ROs, efficiency, and sales—and act before small shortfalls become lost revenue. You’ll get immediate goal visualization that makes targets unambiguous and motivates corrective action. With real-time performance tracking, staff spot gaps fast, iterate behaviors, and close ROs or upsell opportunities before they slip away. Clear, minimal visuals reduce cognitive load so technicians compare results and engage in friendly competition that raises throughput. Data refreshed every 15 minutes sustains accountability and prevents stale insights from undermining momentum. In short, you’ll convert passive reports into an active operational tool that drives measurable gains in productivity and revenue.
Integrate DMS for Accurate, Real‑Time Leaderboards
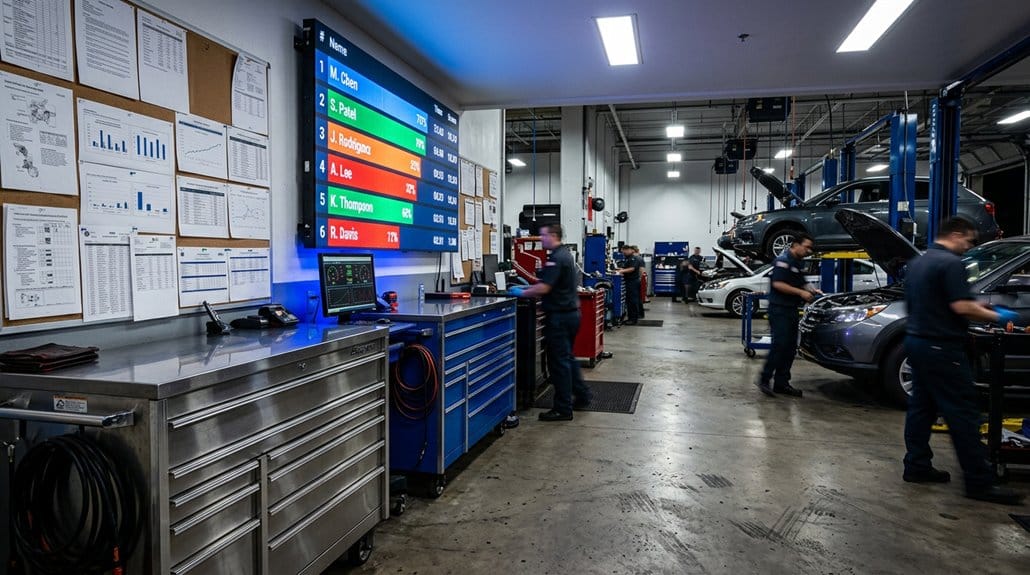
Because integrating your DMS feeds live, leaderboards refresh every 15 minutes so your team sees accurate, actionable KPIs—like technician efficiency, effective labor rate, and advisor sales—in near real time. You get DMS integration that removes reporting lag, delivering real time updates and improved data accuracy for immediate decision-making. That drives measurable performance tracking and boosts employee engagement through visible standings.
Live DMS feeds refresh leaderboards every 15 minutes, delivering accurate KPIs and real-time insights to drive performance and engagement
- Visualize technician efficiency, effective labor rate, and advisor sales to spot trends instantly.
- Use customization options to align metrics with targets, strengthening accountability measures.
- Leverage competitive advantage from timely insights to prioritize coaching and resource shifts.
These features convert static reports into dynamic, motivational tools that quantify productivity and clarify expectations.
Coach and Incent With Leaderboard‑Driven Workflows
Drive performance with leaderboard-driven workflows that turn real-time KPIs into actionable coaching and incentives. You’ll use leaderboards that update every 15 minutes so advisors and techs see current ROs, efficiency, and sales, boosting leaderboard engagement and performance motivation. Embed goal-driven prompts into daily workflows so managers can coach on gaps immediately—short, metric-focused huddles tied to live data replace delayed report reviews. Tie small, measurable incentives (for example, a $15 RO uplift) to visible ranking movement to make impact tangible: research shows that gain can add roughly $1,500 monthly. The result is transparent, accountable behavior change: faster responses, targeted coaching, and incentive systems that reward measurable improvements rather than retrospective summaries.
Measuring ROI: Revenue, Retention, and Culture Gains
Start with measurable outcomes: live leaderboards turn small per-RO gains into outsized returns—just a $15 increase per repair order can translate to roughly $1,500 more revenue each month—while real-time visibility drives a 74% uplift in customer retention for returning service clients. You’ll see revenue growth, tighter accountability, and cultural shifts when data is always front-and-center. Continuous uptime and immediate metrics make coaching timely and effective, boosting team motivation and performance.
- Track: real-time KPIs expose opportunities and top performers for targeted coaching.
- Quantify: modest per-RO improvements scale to meaningful monthly and annual revenue gains.
- Culture: transparency builds engagement, decision-making speed, and sustained retention.
Measure ROI by revenue, retention, and observable culture change.
Quick Rollout Checklist: From Setup to the First 30 Days
Connect the leaderboard via HDMI and Wi‑Fi, and you can be tracking live KPIs within hours—updates every 15 minutes mean you’ll spot performance gaps and top contributors immediately. Use focused setup strategies: map KPIs, assign dashboards, and schedule the deployment timeline with milestones for hardware, user access, and training. In days 1–7 verify feeds; days 8–15 customize reports; days 16–30 measure engagement and coach low performers. Expect immediate impact: managers identify top performers and underperformers for timely coaching, increasing accountability versus static reports.
| Day Range | Action | Outcome |
|---|---|---|
| 1–2 | Hardware & network | Live feed active |
| 3–7 | Data mapping | Accurate KPIs |
| 8–15 | Custom reports | Role alignment |
| 16–30 | Coaching | Performance lift |
Frequently Asked Questions
What Do Fixed Ops Do at a Dealership?
Fixed ops run your dealership’s service and parts, maximizing customer satisfaction and service efficiency by handling maintenance, repairs, parts management, warranty work, and retention strategies, using data and processes to boost profitability, loyalty, and operational consistency.
What Is the Biggest Challenge in Selling Cars Today?
You’re rowing upstream against a storm: the biggest challenge is delivering standout customer experience amid fierce market competition, since inventory limits, rising rates, and EV shifts force you to outpace rivals with faster, data-driven, persuasive service.
Why Is Car Salesman Turnover so High?
You’re seeing high salesman turnover because poor salesman motivation, stressful targets, inadequate training and erratic pay drive turnover causes; data shows near-30% annual exits, so you must improve support, recognition, compensation, and career pathways.
Who Is Responsible for the Overall Dealership Strategy and Performance?
You’re accountable to the General Manager — the strategic leader who owns strategic leadership and ties performance metrics to outcomes; they’ll align fixed and variable ops, use data to drive decisions, and push profitable, measurable improvements.
Conclusion
You’ll see faster, measurable change when you swap static fixed‑ops reports for live leaderboards—teams respond to real‑time visibility. For example, service bays using live displays cut ticket close time by up to 22%, a shift that boosts throughput and revenue quickly. Start small, integrate DMS feeds, set clear KPIs, and tie coaching and incentives to the board. Within 30 days you’ll have cleaner data, higher retention, and a culture that actually moves.