You need live DMS fixed‑ops leaderboards because static reports hide day‑to‑day revenue leaks and delay corrective action; with only 18–25% of DMS data actively used, snapshots miss trends that cost labor yield and CSI. Fifteen‑minute updates give you immediate ELR, hours, ROs and CSI visibility so you can reallocate resources, coach underperformance, and lock in margin gains. It’s operational, measurable, and fast—keep going to see the KPIs, tech needs, ROI and 90‑day outcomes.
Key Takeaways
- Live leaderboards refresh every 15 minutes, enabling immediate action on revenue leaks and productivity issues rather than reacting to stale data.
- Real-time ELR and productivity visibility lets managers reallocate technicians and optimize labor yield throughout the day.
- Continuous KPI tracking (ELR, hours/RO, daily ROs, CSI) identifies trends and flags declines for timely coaching interventions.
- Transparent, up-to-date metrics drive accountability, motivate technicians, and reduce turnover through recognition and clear career paths.
- API-driven dashboards with mobile alerts and TV displays cut reporting delays, saving admin time and producing measurable ROI within 90 days.
Why Static Reports Fail Fixed Ops Teams

When you’re relying on static DMS reports, you’re working off snapshots that quickly go stale and hide the day-to-day issues costing revenue and productivity. You’ll see delayed metrics that prevent timely corrective action, because static report limitations mean data is only as current as the last export. With just 18–25% of the DMS actively used, those snapshots miss usable signals and blunt your performance trend analysis. That gap causes missed upsell and throughput opportunities and reduces accountability when staff can’t compare real progress. Operationally, you need continuous visibility to spot drifts in KPIs, stabilize technician productivity, and close gaps between target and actual performance. Static reports leave you reacting to yesterday instead of optimizing today.
How Live DMS Fixed Ops Leaderboards Deliver Real-Time Decisions
With live DMS leaderboards updating every 15 minutes, you get real-time technician insights that show who’s hitting ELR and productivity targets and who needs coaching now. That immediate visibility lets you make revenue adjustments on the spot—reassigning jobs, reallocating bays, or upping flat-rate focus—to stop leaks and capture lost hours. The result is faster corrective action, higher labor yield, and measurable savings that compound across the month.
Real-Time Technician Insights
Because real-time technician metrics update every 15 minutes, you’ll get immediate visibility into Effective Labor Rate and Technician Efficiency so managers can spot bottlenecks, reassign work, and drive measurable productivity gains. You’ll use live DMS Fixed Ops Leaderboards to run continuous performance analysis, comparing ELR, efficiency, and throughput across bays and shifts. That data-driven view translates to clear technician motivation strategies—targeted coaching, short-term incentives, and workload balancing—so you can reduce idle time and boost billable hours. With 15-minute refreshes you eliminate static-report lag, enabling swift corrective actions and measurable KPI improvements. The result: higher accountability, reproducible productivity gains, and predictable increases in shop capacity and profitability without guesswork.
Immediate Revenue Adjustments
Real-time technician insights set the stage for immediate revenue adjustments by giving you actionable KPI visibility every 15 minutes, so managers can convert operational awareness into instant financial impact. With live ELR and technician efficiency feeds, you spot low sales per RO and missed opportunities the moment they occur, enabling targeted revenue maximization strategies like upsell coaching or reallocating skilled techs. Automated updates hold advisors and technicians accountable, so performance improvement tactics become daily habits rather than monthly corrections. That competitive transparency drives higher service absorption rates and faster issue resolution, converting potential losses into measurable gains. You’ll make data-driven decisions on staffing, RO pricing, and workflow that deliver immediate, trackable lifts in profitability.
Key KPIs to Track on a DMS Fixed Ops Leaderboard (ELR, Hours, ROs, CSI)

A live fixed ops leaderboard gives you a compact, data-driven view of the four KPIs that drive service profitability—Effective Labor Rate (ELR), hours per RO, number of ROs, and Customer Satisfaction Index (CSI)—so you can spot revenue leaks, execution gaps, throughput bottlenecks, and quality issues within minutes. Use Effective Benchmarking to set targets and compare ELR and CSI across locations; real-time ELR flags discounting patterns and advisor behaviors that erode margin. Track hours per RO to expose inspection or execution shortfalls and validate technician capacity. Monitor daily ROs to detect demand shifts and throughput constraints before they impact revenue. Integrate CSI to close the loop on quality and retention. With 15-minute updates, you’ll see Performance Trends immediately and take precise, timely corrective action.
Improve Technician & Service Advisor Accountability With Leaderboards
When you put live DMS leaderboards on the shop floor, technicians and advisors get constant, objective feedback—ELR, hours billed, ROs and CSI—so managers can spot underperformance, coach immediately, and measure improvements in minutes. You gain continuous, 15-minute updates that remove ambiguity and let you apply accountability strategies tied to measurable outputs. With transparent metrics, underperformers are identified quickly and corrective actions are precise: targeted coaching, shift adjustments, or role-specific training. The visible competition also aligns with performance incentives, driving higher utilization and revenue per RO. Managers can celebrate wins in real time, reinforcing behaviors that lift team KPIs. This operational approach turns subjective reviews into repeatable, data-driven interventions that improve shop productivity and profitability.
Coach and Retain Staff Using Leaderboard-Driven Feedback

You’ll use real-time performance coaching from live DMS leaderboards to correct issues immediately and raise technician and advisor productivity. Transparent progress recognition makes achievements measurable and visible, improving morale and reducing turnover. Use leaderboard data to build concise, data-driven development plans that target skill gaps and track improvement.
Real-Time Performance Coaching
Because live DMS leaderboards update every 15 minutes, you can spot ELR and technician-efficiency gaps the moment they emerge and deliver targeted coaching that closes those gaps before they compound into six-figure losses. You’ll use real time feedback and granular performance metrics to run short, actionable coaching huddles, correcting routing, clocking, or documentation errors immediately. That reduces rework, raises billable hours, and improves retention by making expectations clear.
| Metric | Action |
|---|---|
| ELR dip | One-on-one adjustment; reprice checklist |
| Tech efficiency | Hands-on mentoring; pairing with top performers |
| Repeat jobs | Root-cause analysis; process fix |
This operational approach converts static reports into continuous improvement workflows with measurable ROI.
Transparent Progress Recognition
Although live DMS leaderboards update every 15 minutes, they do more than surface problems — they make progress visible, measurable, and immediately actionable so you can recognize wins and correct course in real time. You’ll see individual and team KPIs live, which removes ambiguity from feedback and increases employee engagement by celebrating measurable results as they happen. That visibility drives performance motivation: technicians and advisors compete on transparent metrics, lifting throughput and revenue per RO. Supervisors can intervene quickly when someone slips, delivering targeted coaching tied to current data rather than retrospective reports. The result is a retention-friendly culture where recognition is timely, corrective actions are precise, and operational efficiency improves because everyone aligns daily to shared, trackable goals.
Data-Driven Development Plans
When leaderboard data is used as the backbone of development plans, managers can move from generic coaching to targeted, measurable interventions that improve retention and productivity. You’ll leverage real-time performance metrics and data analysis to identify skill gaps, tailor coaching sessions, and set concrete improvement targets tied to Effective Labor Rate and Technician Efficiency. Immediate visibility lets you provide actionable feedback, recognize top performers, and redeploy training resources where they’ll move the needle fastest. This approach reduces turnover by making progress transparent and career paths measurable. Use leaderboard-driven reviews to align individual goals with dealership KPIs and profitability, fostering trust and engagement.
- Visualize weekly efficiency trends to target coaching
- Highlight top performers for mentorship roles
- Flag declining metrics for rapid intervention
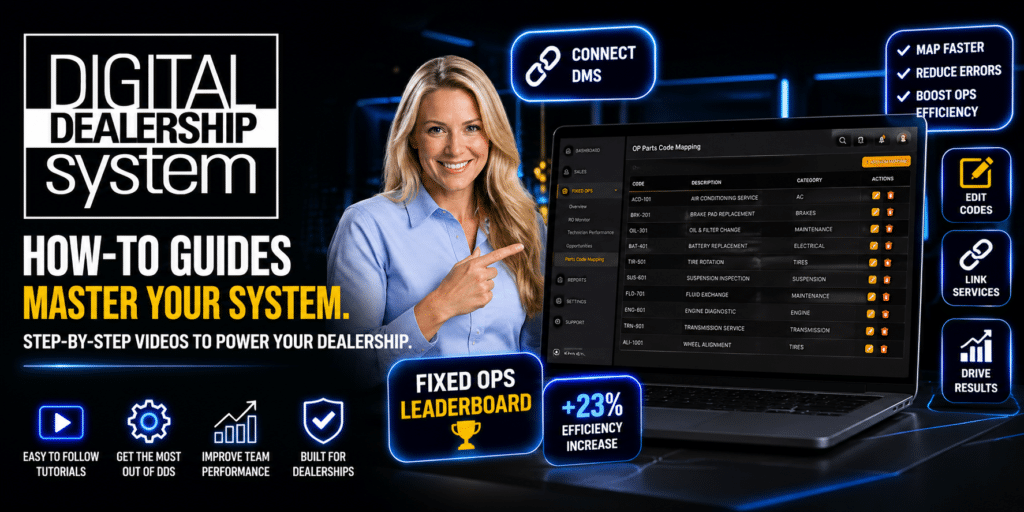
Technical Checklist: DMS Integration, Displays, Mobile App, Uptime
If you want reliable, real-time visibility into shop performance, this technical checklist guarantees your Live DMS leaderboard, displays, and mobile access are configured for continuous, actionable insights. Verify DMS compatibility first: establish seamless API connections to your DMS for live pulls, accurate timestamps, and role-based access so advisors and techs see relevant KPIs. Specify dashboard customization: define widgets, thresholds, and color codes aligned to your SOPs for instant interpretation. For displays, use modern TVs with HDMI, mount for sightlines, and set auto-refresh to 15-minute intervals. Confirm mobile app provisioning, push alerts, and secure SSO so managers can intervene anywhere. Require 99.999% uptime SLAs, monitoring, and failover to prevent data gaps and support continuous operational decisions.
Quick ROI: Cost, Time-to-Value, and Margin Gains
Because real-time visibility cuts reporting delays from days to minutes, a live DMS leaderboard delivers fast, measurable ROI: for about $499/month you get 15-minute updates that trim administrative reporting time, surface revenue opportunities per RO, and drive higher ELR through timely coaching and competition. You’ll run a clear cost analysis comparing subscription fees to labor-hours saved and incremental gross per RO. Performance metrics are tracked continuously, so you act on small wins before they compound. Expect precise, operational gains rather than vague promises.
Real-time DMS leaderboards cut reporting from days to minutes—$499/month for 15‑minute updates, faster ROI and measurable ELR gains.
- Visualize saved hours per week and converted upsells per advisor.
- Picture ELR improvements month-over-month and incremental gross profit per RO.
- Imagine simplified audits with integrated DMS performance metrics and real-time alerts.
Time-to-Value: What to Expect in 30–90 Days
30 days is usually all it takes to start seeing real-time visibility into Fixed Ops metrics, giving you immediate accountability and the ability to act on underperforming RO trends within minutes rather than days. You’ll see measurable performance improvement as staff respond to transparent KPIs, boosting team motivation and short-term productivity.
| Timeframe | Expected Outcome | Key Metric |
|---|---|---|
| 30 days | Real-time visibility | Alerts/minute |
| 45 days | Rising technician efficiency | Jobs/hour |
| 60 days | ELR improvement | Effective labor rate |
| 75 days | Better advisor follow-ups | Follow-up rate |
| 90 days | Higher CSI and RO revenue | Revenue/RO |
Within 90 days, dynamic insights translate into higher CSI and revenue per RO, enabling proactive coaching and sustained operational gains.
Implementation Roadmap: Deploy, Train, Measure, Iterate
Having established measurable gains within the first 90 days, you’re ready to move into a focused implementation roadmap that turns visibility into repeatable performance. Deploy a live DMS fixed ops leaderboard with leaderboard customization to match your KPIs, integrate data visualization dashboards into shop floors, and set baseline metrics. Train service advisors and techs on reading live KPIs, goal-setting, and quick corrective actions so adoption reduces the typical 75% underutilization of DMS data. Measure daily using live feeds to spot trends static reports miss, then iterate governance, thresholds, and recognition programs based on frontline feedback.
- Deploy: configure, test, launch visible dashboards.
- Train: role-specific sessions, micro-coaching.
- Measure & iterate: weekly sprints informed by live data visualization.
Frequently Asked Questions
How Much Does a Car Salesman Make off a $20,000 Car?
Like a telegraph era signal, you’ll earn roughly $2,000–$3,000 from a $20,000 sale, assuming 10%–15% sales commission on gross; variations depend on profit margins, bonuses, and your negotiation and performance metrics.
What Is DMS for Car Dealerships?
DMS for car dealerships is a centralized software that manages operations; you’ll see DMS benefits in streamlined workflows, DMS features for inventory and service, DMS integration across systems, and improved DMS efficiency driving measurable operational results.
What Is the Biggest Challenge in Selling Cars Today?
Hands down, your biggest challenge is standing out in value: you’ve got to excel at customer engagement strategies and competitive pricing tactics, using real-time metrics and operational discipline to boost conversions and margin predictably and measurably.
Why Are Car Dealerships Always on the Same Street?
They’re clustered because you’re optimizing for location consistency and combatting market saturation; data shows dealerships drive traffic by proximity, shared customer pools, and competitive benchmarking, so you’ll prioritize operational efficiency, visibility, and measurable footfall results.
Conclusion
You need live DMS fixed‑ops leaderboards to stop guessing, start acting, and keep improving. You’ll see metrics update in real time, hold techs and advisors accountable, and coach with data — boosting ELR, hours, and ROs while protecting CSI. You’ll reduce wasted hours, recover missed revenue, and improve margins. Deploy fast, measure constantly, and iterate relentlessly—so you’re not reacting to stale reports, you’re driving measurable, operational results every single day.