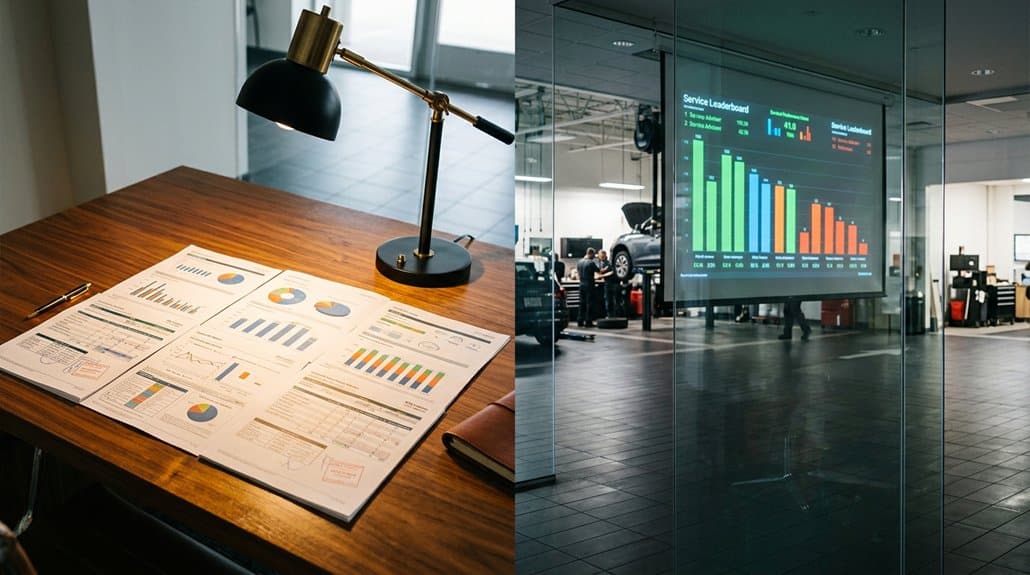
You’ll get historical trend analysis and benchmarking from fixed ops reports, which suit periodic reviews, budgeting, and root‑cause studies using service, parts, and body revenue metrics. Live service leaderboards give real‑time KPIs—technician efficiency, effective labor rate, ROs per 15 minutes—and enable immediate corrective actions, live coaching, and accountability through rankings. Use both: reports for long‑term strategy and leaderboards for operational control, and keep going to see implementation steps, KPIs, and an operational checklist.
Key Takeaways
- Fixed Ops reports deliver historical, periodic analysis for benchmarking, budgeting, and long-term trend identification.
- Live service leaderboards provide real-time KPIs for immediate corrective actions and operational control.
- Fixed Ops focuses on revenue breakdowns (service, parts, body shop), absorption rates, and multi-week trends.
- Leaderboards track technician/advisor metrics (efficiency, effective labor rate, appointment/RO counts) updated every 15 minutes.
- Combine both: use leaderboards for day-to-day performance and fixed ops for strategic planning and capacity forecasting.
Which to Use: Fixed Ops Reports vs Live Leaderboards
While Fixed Ops Reports give you a reliable record of historical trends, you’re better served by Live Service Leaderboards when you need real-time visibility and rapid corrective action: you’ll choose based on clear comparison factors. Use Fixed Ops Reports for retrospective analysis, strategy validation, and trend attribution where data lag isn’t critical. Opt for Live Leaderboards when you need 15-minute DMS-connected updates, continuous monitoring of performance metrics, and customizable KPIs like technician efficiency or effective labor rates. The process-driven advantage of Live Leaderboards is immediate anomaly detection, streamlined cross-functional communication, and rapid remediation workflows. In practice, combine both: Fixed Ops for long-term benchmarking, Live Leaderboards for operational control, escalation, and driving frontline engagement through real-time competition.
What Fixed Ops Reports Measure and When to Rely on Them
After weighing when to rely on live leaderboards versus fixed ops reports, it helps to pin down exactly what those fixed ops reports measure and when you should use them. You’ll find they catalog historical performance metrics—service absorption rates, average repair order values, hours per repair order, effective labor rates, and technician productivity—over set intervals like monthly or quarterly. Use them to identify long-term trends, benchmark efficiency, and prioritize strategic initiatives that improve profitability. Revenue insights from service, parts, and body shop lines reveal where margin expansion is possible and which departments need attention. Rely on these reports for periodic assessments, budgeting, and performance reviews, but not for immediate operational adjustments that require real-time visibility.
What Live Service Leaderboards Track and When They Help Most
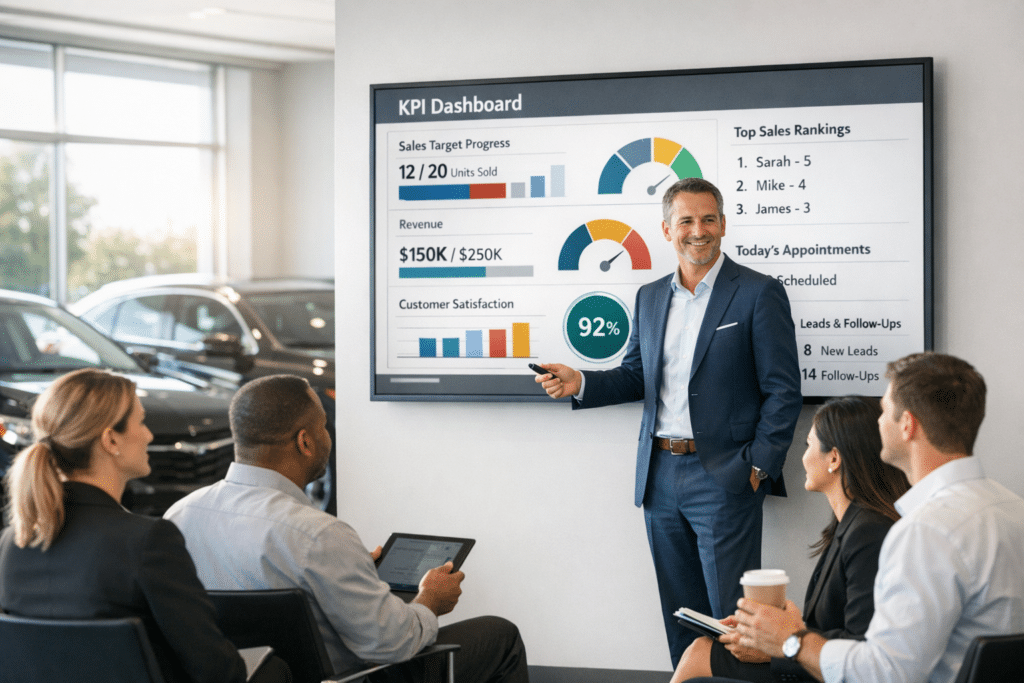
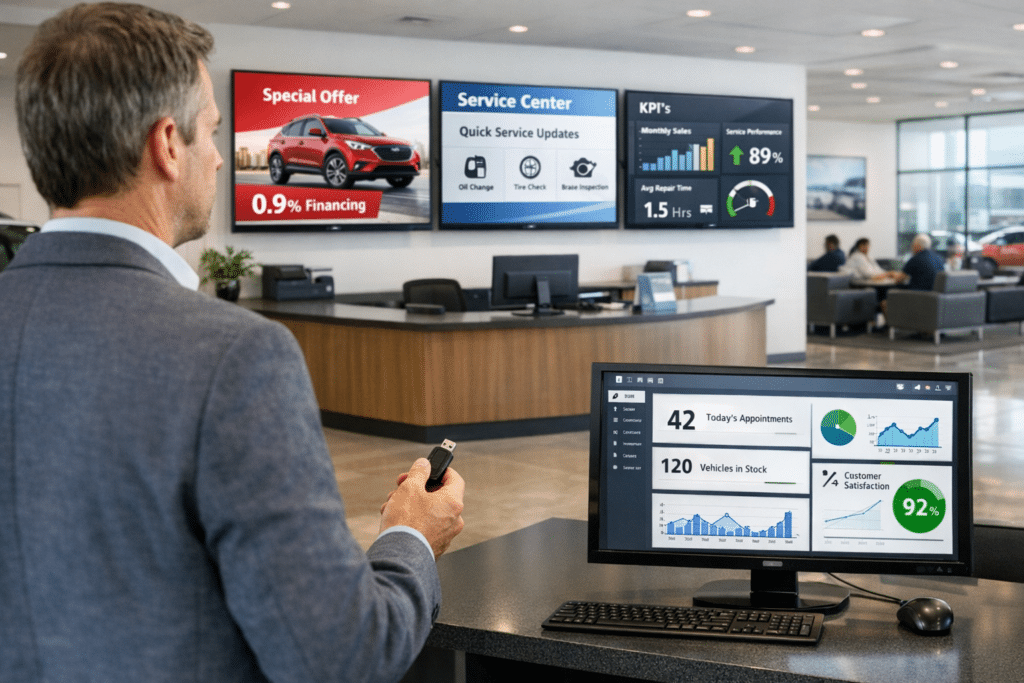
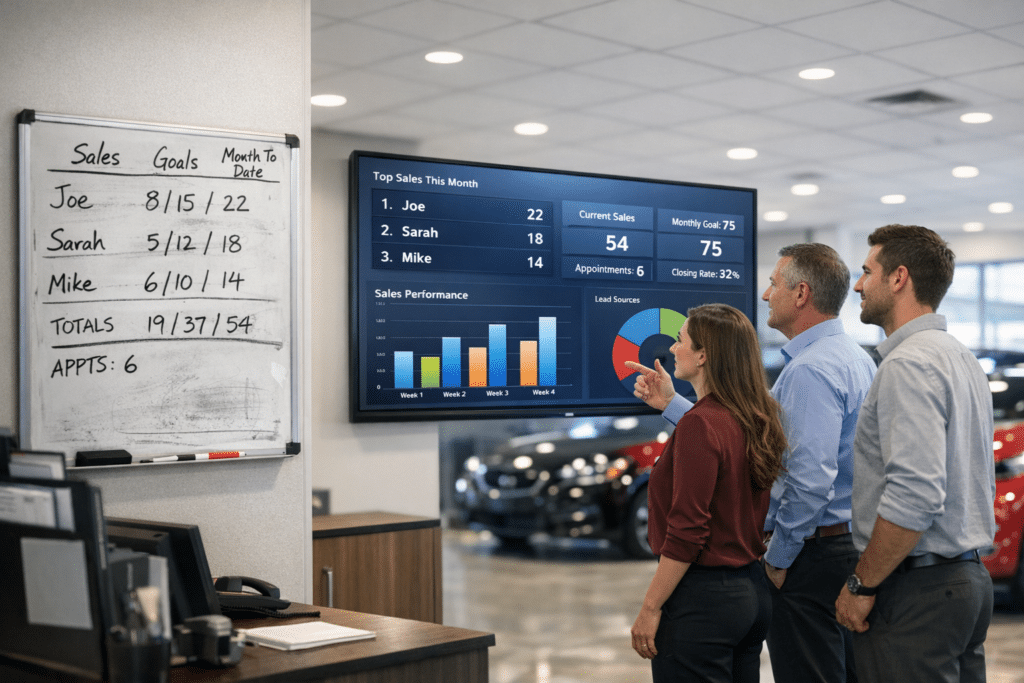
You’ll see real-time technician metrics, appointment and RO flow, and sales and labor goals on a live leaderboard, each updating every 15 minutes to surface variances from target. That near-instant visibility lets you spot slow bays, missed appointments, or advisors falling short on labor sell-through and trigger specific corrective actions. When you need immediate course-correction—shift-level coaching, rebalancing technician assignments, or pushing targeted sells—these dashboards deliver accurate, DMS-synced data to act on.
Real-Time Technician Metrics
Because live service leaderboards refresh every 15 minutes and pull directly from your DMS, they give you up-to-the-minute technician metrics—Efficiency, Effective Labor Rate, and Hours per Repair Order—so you can spot performance trends, address slowdowns, and reallocate work before end-of-day reports would even register the change. You get real time updates on each tech’s output, enabling granular comparisons and boosting technician engagement through visible KPIs. Mobile and desktop access means you can act immediately when a metric dips.
- Efficiency by tech — identifies throughput gaps and capacity for additional RO assignments.
- Effective Labor Rate — flags revenue variance by labor mix.
- Hours/RO — reveals time overruns vs. standard labor times.
- Live ranking — promotes accountability and targeted coaching.
Appointment And RO Flow
When you tie live leaderboards to your DMS, they refresh every 15 minutes so you can watch appointment counts, ROs created, and technician throughput change in near real time—letting you reassign work, adjust bays, or call in additional staff before backlogs form. You’ll see appointment management and RO optimization move from guesswork to measurable processes: scheduled vs. arrived, ROs opened per hour, and technician cycle time. Use that cadence to compare against targets, spot bottlenecks, and trigger corrective actions.
| Metric | Frequency | Action |
|---|---|---|
| Appointments scheduled | 15 min | Reassign/adapt bays |
| ROs opened | 15 min | Redistribute workload |
| Tech throughput | 15 min | Call in staff |
This keeps accountability tight and throughput predictable.
Sales And Labor Goals
Although live service leaderboards update every 15 minutes and pull directly from your DMS, they do more than display numbers — they turn sales and labor goals into actionable, measurable workflows by tracking advisor sales, ROs, labor hours, effective labor rate, and technician efficiency in near real time. You’ll get immediate visibility into where sales strategies are working and where labor optimization is required, so you can reallocate technicians, push targeted upsells, or adjust scheduling to protect throughput. The system creates accountability and motivates staff through transparent, timely metrics that map to daily objectives.
- Monitor advisor sales and RO conversion to refine sales strategies.
- Track technician hours and effective labor rate for labor optimization.
- Flag underperforming bays for coaching or rescheduling.
- Align individual KPIs with storewide targets continuously.
Real-Time vs Periodic Analysis for Service Departments
You’ll use real-time leaderboards to make immediate, data-backed adjustments—redistributing technicians, prioritizing ROs, or coaching advisors when 15-minute updates show performance dips. Periodic fixed ops reports, however, are better for identifying multi-week trends, seasonality, and strategic staffing or training needs that aren’t visible in minute-by-minute fluctuations. Combine both: act on live metrics for operational control and use periodic analysis for capacity planning and long-term process improvements.
Real-Time Decision Making
One clear advantage of live service leaderboards is that they refresh every 15 minutes, giving you near-instant visibility into KPIs like advisor sales and technician efficiency so decisions aren’t made on stale data. You get real time responsiveness and data driven agility: continuous syncing maintains accuracy, automated alerts flag declines, and customizable KPIs focus coaching on measurable outcomes. That lets you redeploy resources, adjust schedules, or coach advisors immediately instead of waiting for a batch report.
- Detect underperformance within a quarter-hour and trigger an alert for immediate intervention.
- Reallocate technicians or bays based on live efficiency metrics.
- Launch targeted coaching when advisor sales dip against goal.
- Maintain audit trails from automated syncs to validate actions taken.
These processes prioritize speed, precision, and accountability.
Periodic Trend Analysis
Periodic trend analysis compares snapshots of service performance over defined intervals—day, week, month, quarter—to reveal patterns and root causes that real-time leaderboards alone can miss. You’ll use trend identification to detect recurring slowdowns, seasonal demand shifts, and technician learning curves that single-point metrics obscure. Build standardized interval reports, apply consistent KPI definitions, and use data visualization to map trajectories for throughput, RO per repair order, and retention. Compare periodic anomalies against live leaderboard events to validate causes and timing. Maintain audit trails for data sources and update cadences so reconciliations are minimal. Use findings to redesign workflows, schedule staffing, and set training targets, while relying on live leaderboards for immediate course corrections between reporting periods.
How Reports and Leaderboards Change Advisor and Technician Behavior
Because real-time leaderboards stream live metrics to the shop floor, advisors and technicians can change behavior immediately—tweaking upsell pitches, reallocating labor, or prioritizing repairs based on current throughput and revenue-per-ro; static fixed-ops reports, by contrast, often arrive after the fact and force decisions to be retrospective rather than corrective. You’ll see measurable behavioral shifts: real-time visibility drives rapid micro-adjustments and accountability, while delayed reports produce lagged, batch corrections. Leaderboards increase performance motivation by exposing rankings and gaps, enabling targeted coaching and immediate corrective actions. You can operationalize this through clear processes:
- Monitor live KPIs to trigger immediate corrective tasks.
- Use ranking data to set short, measurable goals.
- Coach on observed gaps via interactive dashboards.
- Convert realtime wins into repeatable workflows.
Data Sources, DMS Syncing, and Accuracy Pitfalls to Watch
When your team depends on accurate, timely KPIs, the choice of data sources and the reliability of DMS syncing become mission-critical: fixed-ops reports pull historical snapshots from multiple systems and often reflect reconciled, human-curated entries, while live service leaderboards ingest near-real-time transactions via automated DMS integration (typically updating every 15 minutes), reducing manual entry exposure and enabling immediate course corrections; however, that speed only helps if mappings, field definitions, and error-handling are correctly configured, since inconsistent SKU codes, mismatched labor capture, or poor timestamp alignment can still produce misleading metrics.
| Source Type | Typical Issue |
|---|---|
| Historical reports | reporting limitations, stale records |
| Live leaderboards | syncing challenges, mapping errors |
| Both | data accuracy, timestamp misalignment |
You’ll need rigorous validation, clear field definitions, and monitoring to preserve performance insights and enable valid historical comparisons.
Choosing the Right Mix: Use Cases, ROI, and Handoffs
How should you balance live service leaderboards and traditional fixed-ops reports to maximize ROI and operational handoffs? You’ll pair real-time leaderboards for day-to-day execution with periodic fixed-ops reports for strategic review. Live dashboards drive immediate revenue optimization (≈15% uplift potential) through scheduling adjustments and DMS-synced accuracy; reports validate trends and inform quarterly planning. Use clear accountability measures and performance benchmarks to align staff.
Pair real-time leaderboards for daily execution with periodic fixed-ops reports for strategic validation and measurable ROI.
- Deploy leaderboards for shift-level engagement strategies and instant corrective actions.
- Use weekly fixed-ops reports to confirm accuracy, audit anomalies, and refine targets.
- Define handoff protocols: when to escalate real-time alerts into report-driven investigations.
- Measure ROI by tracking revenue lift, reduced manual errors, staff engagement, and benchmark attainment.
Implementation Checklist: KPIs, Alerts, Displays, and Training
You’ve set the strategic rhythm—now map the operational mechanics: create a concise implementation checklist that ties KPIs, alerts, displays, and training to measurable outcomes and handoff rules. Start with KPI selection: pick customizable metrics (advisor efficiency, effective labor rate, CSAT) and define baseline, target, and delta values. Document Alert thresholds per metric, assign escalation paths, and specify who acknowledges alerts within set SLAs. Define Display strategies: locations (TVs, tablets, mobile), refresh rate, role-based views, and visibility rules for sensitive data. Build Training programs that teach data interpretation, response protocols, and coach-level remediation. Require DMS integration validation, daily data integrity checks, and a 30/60/90-day review cadence to adjust KPIs, thresholds, displays, and training based on measured outcomes.
Frequently Asked Questions
What Are Fixed Ops at a Dealership?
Fixed ops are your dealership’s service, parts, and body shop operations that drive steady revenue and high gross margins; they’re measured by service quality and customer satisfaction metrics, process efficiency, absorption rate, and repair throughput.
What Three Departments Comprise the Fixed Operations of a Dealership?
The three departments are service, parts, and the body shop. You’ll evaluate service department roles, parts inventory, and collision processes to optimize operational efficiency, using data-driven metrics, workflows, and KPI tracking for continuous improvement.
What Is the Difference Between Fixed Operations and Variable Operations?
Fixed operations are steady, service-focused revenue centers; variable operations fluctuate with sales. You’ll track Service Revenue and Operational Efficiency in fixed ops, using data-driven processes to optimize margins, predict cash flow, and reduce volatility.
What Is the Difference Between a Dealership Service Department and an Independent Service Facility?
Imagine you brought a warranty-covered Camry; dealerships offer OEM parts, higher technician training, superior service quality and consistent customer experience, while independents use varied pricing strategies, faster turnaround, flexible parts choices, and often lower labor costs.
Conclusion
Think of your service department as a ship: fixed ops reports are the navigational charts—accurate, vetted, plotted from synced DMS data—while live leaderboards are the helm’s instruments, updating crew actions in real time. You’ll use charts for strategic routing and audits, instruments for tactical course corrections. Define KPIs, set alerts, validate data flows, and train crews on handoffs so the ship stays efficient, accountable, and driven by verifiable, timely metrics.