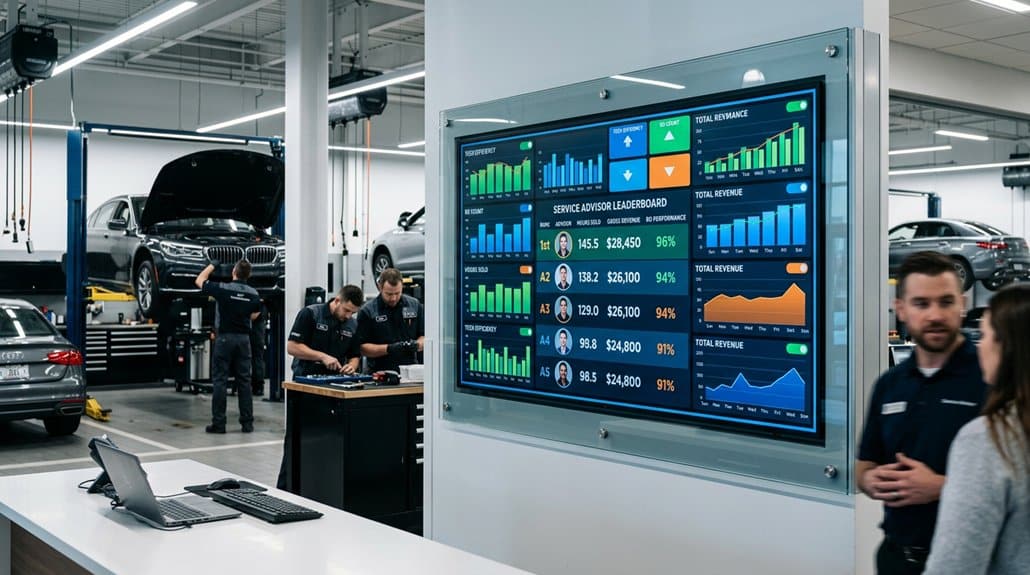
Service advisor leaderboards provide dealerships with a detailed, data-driven perspective on hours, gross profit, and repair order (RO) performance. You’ll gain insights into how each advisor is contributing, fostering accountability and identifying top performers. This tool supports strategic decision-making through real-time updates and helps optimize service operations by tracking essential metrics effectively. Additionally, service advisor leaderboards empower you to tailor coaching and incentive strategies, ultimately boosting performance and profitability. Stay tuned for a deeper understanding of these benefits.
Key Takeaways
- Leaderboards provide real-time updates to track hours, improving service efficiency and productivity.
- They benchmark advisor performance metrics like gross profit and average RO, driving accountability and competition.
- Detailed tracking of RO performance helps identify sales opportunities and enhance revenue through upselling.
- Performance metrics integration facilitates easy access, enabling data-driven decision-making to optimize operations.
- Real-time performance feedback supports tailored coaching, improving service effectiveness and advisor growth.
Maximize Performance: The Benefits of Leaderboards

When you implement service advisor leaderboards, the result is a clear, data-driven approach to maximizing performance within your dealership. These leaderboards serve as a powerful engagement strategy, helping to foster healthy competition among your team. By focusing on performance benchmarking, you’re able to precisely measure key metrics like hours per repair order (RO), gross profit, and RO value. This transparency enhances accountability and lets you identify top performers who excel in upselling, boosting average RO value and driving additional revenue. In addition, by tracking effective labor rates, you can spotlight those advisors contributing notably to profitability. Regular updates of rankings motivate continuous improvement, encouraging advisors to refine customer engagement and communication skills, ultimately elevating service department efficiency.
How to Implement Service Advisor Leaderboards
To successfully implement service advisor leaderboards within your dealership, start by clearly defining the performance metrics you’ll track, such as hours per repair order (RO), gross profit, and average RO value. This alignment guarantees your leaderboard design directly supports dealership goals. Utilize a user-friendly platform that integrates with existing systems for seamless data collection and display. Real-time updates provide immediate performance feedback, encouraging advisors through visualization of their standing in comparison to peers. This approach keeps advisors accountable and driven toward continuous improvement. Regularly review leaderboard results to identify training and coaching opportunities. Consistent monitoring not only highlights individual achievements but also enhances overall department performance and profitability. Prioritize a strategic implementation to maximize the benefits of service advisor leaderboards.
Hours Sold: Driving Productivity and Revenue
You’ll want to focus on optimizing technician efficiency by analyzing the actual hours sold compared to the time technicians are clocked in, ensuring maximal use of their available hours. Tracking billing consistency is equally important, as discrepancies can highlight areas where service advisors need to enhance their communication and upselling techniques. Using detailed data from leaderboards, you can pinpoint inefficiencies and strategize adjustments to boost productivity and elevate revenue.
Optimize Technician Efficiency
- Analyze Hours Sold Data: Scrutinize the ratio of billed hours to clocked hours to identify efficiency gaps. This helps in minimizing wasted labor time and optimizing scheduling to better align with demand.
- Monitor Key Performers: Consistently track Hours Sold to spot high performers, providing a data-driven approach to honing lower-tier technicians’ skills through targeted coaching.
- Make Data-Driven Decisions: Use insights from Hours Sold to adjust staffing levels, improve tool availability, and identify training requirements, ensuring sustained productivity and higher revenue generation.
Track Billing Consistency
Building on the need to optimize technician efficiency, focusing on billing consistency becomes a vital aspect of maximizing productivity and revenue for dealerships. Precise billing accuracy guarantees that every hour sold mirrors the actual hours worked, driving better labor analysis. It’s essential to compare clocked and billed hours through regular checks and real-time dashboards. This approach helps identify discrepancies, guiding you to correct productivity gaps effectively. Setting benchmarks for Hours Sold and contrasting them against labor performance targets fosters operational efficiency, contributing to increased Average RO values.
| Metric | Importance |
|---|---|
| Billing Accuracy | Enhances trust, reflects true scope of work |
| Labor Analysis | Maximizes technician output, boosts profitability |
| Hours Sold | Key for tracking efficiency, influences revenue outcomes |
Monitor Gross Profit for Effective Pricing Strategies
When aiming to craft effective pricing strategies, monitoring gross profit becomes indispensable, as it enables dealerships to assess service profitability and pinpoint potential improvements. Regular profitability analysis helps you make informed pricing adjustments, ensuring you remain competitive. Aim for a healthy 20% gross profit margin, enabling reinvestment in quality service.
Monitoring gross profit involves:
- Gross Profit Trends: Identify trends to adjust pricing strategies in response to market dynamics and customer feedback.
- Service Advisor Leaderboards: Use leaderboards to highlight metrics, fostering competition and a culture of accountability.
- RO Tracking: Regular tracking lets you fine-tune offerings to meet customer needs and maximize revenue.
Harness these insights to enhance overall performance, ensuring your dealership remains adaptable and profitable.
Average RO Value Revealed: Making Data-Driven Decisions

When you focus on the Average Repair Order (RO) value, you’re zeroing in on a core performance metric that reveals your service advisors’ effectiveness in revenue generation. By leveraging detailed data and real-time leaderboards, you can pinpoint areas for improvement and enhance your team’s ability to maximize repair order profitability. This approach guarantees you’re not just tracking numbers, but actively enhancing advisor performance and refining sales strategies for superior customer outcomes.
Maximizing Repair Order Profitability
Despite common beliefs about boosting profitability being solely reliant on increasing service volume, focusing on maximizing the Average Repair Order (RO) value actually holds the key to substantial gains for a dealership’s service department. By prioritizing repair order enhancements through meticulous Multi-Point Inspections (MPI), you allow service advisors to identify upselling opportunities that resonate with customer needs. This process involves detailed write-ups and accurate diagnostics, preventing lost revenue due to missed issues. Data-driven decisions based on Average RO value empower advisors to effectively pitch necessary services, increasing approval rates.
Consider these strategies:
- Conduct Thorough MPIs: Identify and present critical repairs clearly.
- Utilize Key Performance Indicators: Track RO value, hours, and approval rates for insights.
- Review RO Trends Regularly: Implement successful upselling strategies.
Enhancing Advisor Performance Metrics
Maximizing Average Repair Order (RO) value requires more than enhancing service volume; it necessitates precise data-driven strategies that can transform your service department’s profitability. By focusing on performance benchmarks, you’ll gain invaluable insights to boost advisors’ effectiveness. High-performing advisors elevate average RO values through clear Multi-Point Inspections and persuasive communication. Tracking these values lets you pinpoint trends and refine upsell strategies, leading to increased revenue and streamlined operations. With benchmarking, you can evaluate your advisors against industry standards, allowing for tailored coaching strategies that hone their sales approach and customer interaction skills. Real-time data dashboards further illuminate advisor performance, encouraging focused improvement efforts. By leveraging these insights, your dealership can maximize profitability and refine service efficiency.
Leveraging Data for Improvement
Leveraging data can transform your dealership’s service profitability and operational efficiency. By harnessing data visualization and performance analytics through service advisor leaderboards, you gain essential insights into Average Repair Order (RO) values. Real-time visibility enables you to pinpoint top performers and identify areas ripe for improvement.
Consider these strategies for leveraging this data:
- Benchmarking: Compare advisors against peers to foster a competitive spirit and boost individual and team performance.
- Targeted Training: Use trend analysis to deploy targeted training, enhancing advisors’ ability to communicate effectively and increase average RO values.
- Strategic Adjustments: Base pricing strategy decisions on data, ensuring they align with customer expectations and maximize sales potential.
Data-driven decisions are vital for optimizing service operations and profitability.
Cultivate Competition to Boost Advisor Performance
To effectively boost advisor performance within a dealership, implementing service advisor leaderboards cultivates a competitive environment that drives substantial improvements. You can foster healthy competition by visibly showcasing top performers on metrics like hours billed and gross profit per RO. With performance incentives and recognition programs, advisors are motivated to engage more, aiming for greater sales through refined sales strategies. Regularly updated leaderboards serve as accountability mechanisms that promote goal setting techniques, where advisors track their progress against peers and take initiative in improvement. This not only sustains team motivation but also increases advisor engagement. Such competitive elements directly result in improved approval rates, higher average RO dollars, and overall enhanced productivity. Ultimately, this leads to elevated service quality and increased revenue generation.
Detect Trends Using Real-Time Metrics
Real-time metrics have become a game-changer for dealerships aiming for peak service advisor performance. By leveraging these metrics, you can rapidly engage in trend identification and gather performance insights that drive service improvement.
Here’s how real-time leaderboards can transform your operations:
- Metric Analysis: With immediate data visualization, analyze key metrics such as hours billed and gross profit to identify performance patterns.
- Coaching Effectiveness: Use insights from competitive benchmarking to tailor coaching strategies, enhancing advisor engagement and efficacy.
- Trend Responsiveness: Spot emerging trends, like fluctuating RO values, in real-time, allowing quick adjustments to strategies for optimizing customer satisfaction.
Tracking data dynamically empowers you to stay ahead in a competitive landscape, ensuring your dealership’s success through informed decision-making.
Utilize Metrics for Improved Customer Service Experience
To enhance communication efficiency, regularly review the approval rates displayed on leaderboards, allowing you to refine your interactions and tailor your approach to meet customer expectations. Optimize service operations by monitoring hours billed per repair order; this guarantees you’re managing time and technician productivity effectively. Real-time scorecards linked to leaderboards not only hold you accountable but also facilitate proactive follow-ups on declined services, ultimately improving overall service metrics.
Enhance Communication Efficiency
While many factors contribute to a stellar customer service experience in a dealership setting, leveraging service advisor leaderboards can be transformative by honing communication skills. These leaderboards provide real-time metrics that enhance service clarity, fostering customer trust and streamlining feedback loops to overcome communication barriers. You’ll find that digital tools enable:
- Active Listening and Empathy Training: Identifying and responding quickly to customer concerns, improving follow-up strategies.
- Message Consistency and Conflict Resolution: Tracking approval rates offers insights into communication efficiency, ensuring consistent messaging that boosts service approval.
- Efficient Follow-Up: Monitoring daily performance sharpens your follow-up strategies, using precise data to complete more previously declined services, increasing revenue without enlarging your team.
Harnessing these insights supports better time management and message delivery.
Optimize Service Operations
Service advisor leaderboards are pivotal for optimizing service operations, using precise metrics to elevate the customer service experience. By tracking real-time data like hours billed, gross profit, and average RO performance, you can pinpoint top performers and uncover areas for improvement. These metrics empower effective customer engagement strategies and drive performance recognition programs, enhancing advisor accountability and service efficiency. The approval rate of recommended services also fosters better communication, building trust with customers. Competitions based on hours per RO boost productivity, ensuring quicker service and higher satisfaction levels. Regular updates fine-tune your focus on achieving goals, solidifying continuous improvement.
| Metric | Purpose | Outcome |
|---|---|---|
| Hours per RO | Enhance competition | Boost productivity |
| Approval rate | Improve communication skills | Strengthen customer trust |
| Gross profit | Maximize efficiency | Elevate customer satisfaction |
Leverage Insights for Advisor Growth and Coaching
How can you effectively harness the power of service advisor leaderboards to drive growth and enhance coaching? By providing real-time performance feedback, leaderboards become crucial tools for developing tailored coaching strategies and motivational techniques. Here’s how:
Real-time leaderboards empower personalized coaching and foster motivation, driving advisor growth and service excellence.
- Coaching Strategies: Analyze individual metrics to craft personalized skill development plans. These insights help identify areas needing improvement and focus training methods accordingly.
- Performance Feedback: Use leaderboards for clear accountability measures. This encourages advisors to self-correct and excel in selling recommended services.
- Motivational Techniques: Foster a competitive dynamic through peer recognition and performance-based incentives. This not only boosts individual performance but enhances overall department profitability.
Implementing these strategies will optimize advisor growth, leveraging competitive dynamics to guarantee sustained evolution in service excellence.
Tech Integration for Service Advisor Efficiency
Real-time performance feedback from service advisor leaderboards not only refines coaching strategies but also sets the stage for seamlessly integrating technology to boost efficiency. By leveraging tools like PULSE, you can harness data visualization for a clear view of key performance metrics such as hours billed, gross profit, and average repair order value. This transparency fosters healthy competition and accountability among advisors, while centralized dashboards provide immediate performance benchmarking. Such integration allows you to streamline active follow-ups and automated alerts, reducing approval times considerably. Embracing tech-driven insights highlights top performers and identifies areas needing improvement, encouraging a data-driven culture. Ultimately, these innovations enhance service productivity, positively impacting gross revenue and driving customer satisfaction.
Frequently Asked Questions
What Are the 4 Pillars of KPI?
You know the four pillars of KPI importance: Approval Rate, Average Repair Order Dollars, Hours Per RO (HPRO), and Time-to-Approval. These KPI examples deliver detailed, data-driven insights essential for optimizing service performance and enhancing dealership profitability.
What Are the 5 Main KPIS?
You’re traversing the landscape of performance metrics, and the five main KPIs you’ll focus on are Approval Rate, Average RO Dollars, Hours Per RO, Time-to-Approval, and Follow-Up Completion Rate for Declined Services.
What Are KPIS for Car Dealerships?
You’re focusing on KPIs like average RO dollars, labor hours billed, upsell ratios, and the customer satisfaction index. These metrics boost operational efficiency by highlighting performance areas, ensuring high customer satisfaction, and driving revenue generation.
Do Service Advisors at Dealerships Earn Commission?
Yes, you do earn commission. Your commission structures usually include percentages from repairs and sales, ranging from 10% to 20%. Performance incentives often tie into KPIs, aiming to boost service quality, upsells, and overall dealership profitability.
Conclusion
By implementing service advisor leaderboards, you’ll boost productivity, increase revenue, and enhance customer satisfaction. You’ll track hours with precision, monitor gross profit with insight, and reveal average RO value with clarity. You’ll detect trends with real-time data, leverage insights for coaching, and integrate technology for efficiency. Embrace a performance-focused, data-driven approach, and transform your dealership into a powerhouse of efficiency and growth. Don’t just track metrics—use them to drive excellence and release potential.