Ever walk onto your service floor and realize you have no clue how your team is doing right now, this shift, this hour? That’s the reality for a lot of fixed ops departments still stuck waiting on spreadsheets and monthly reports.
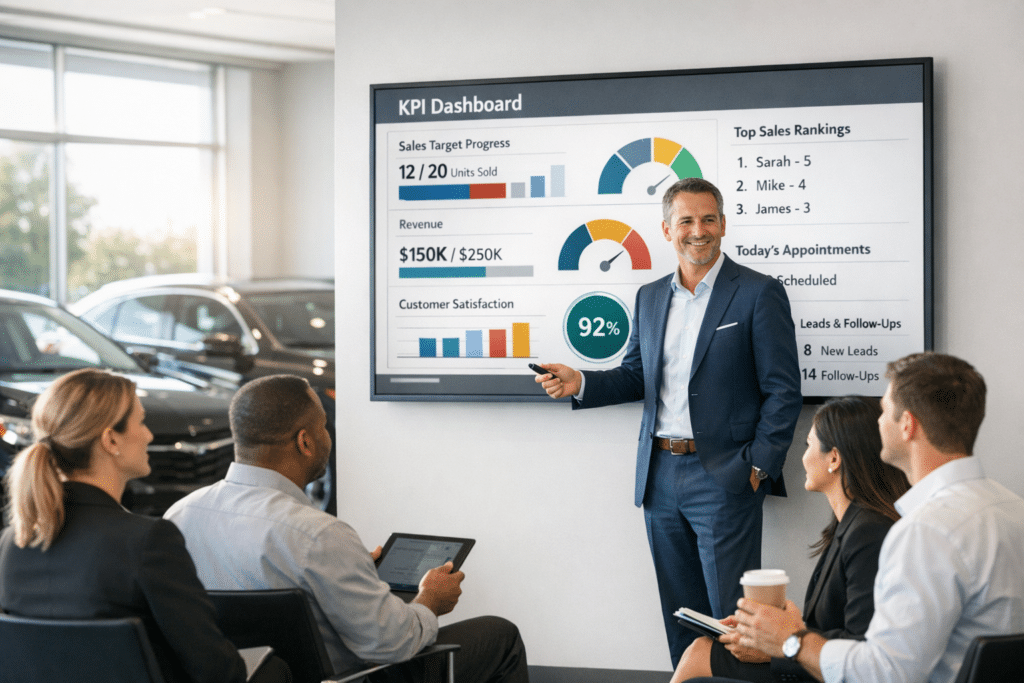
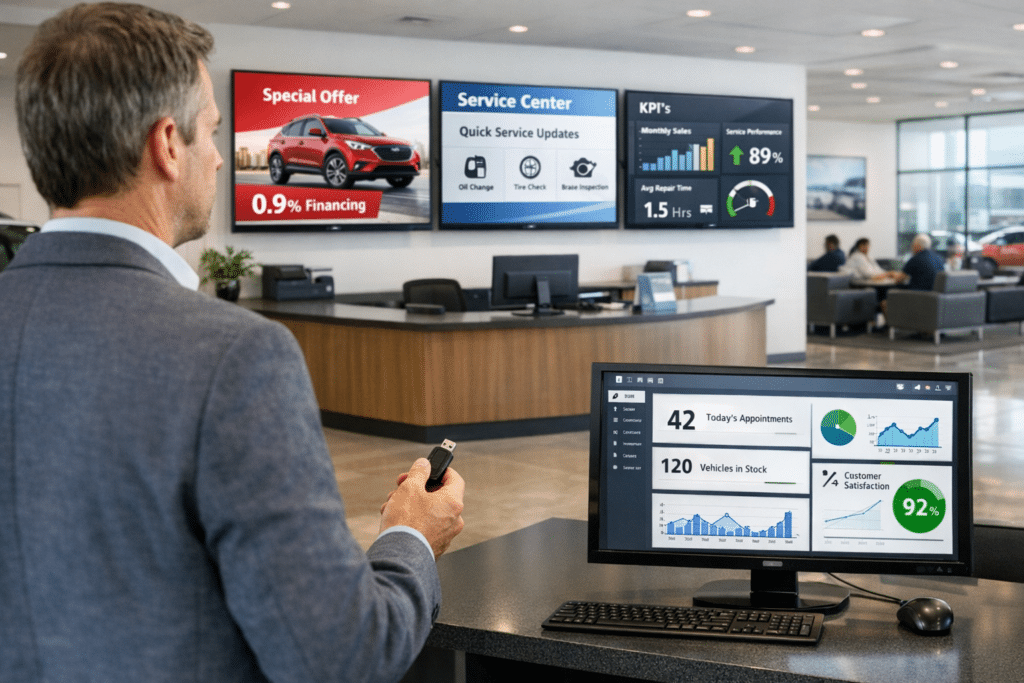
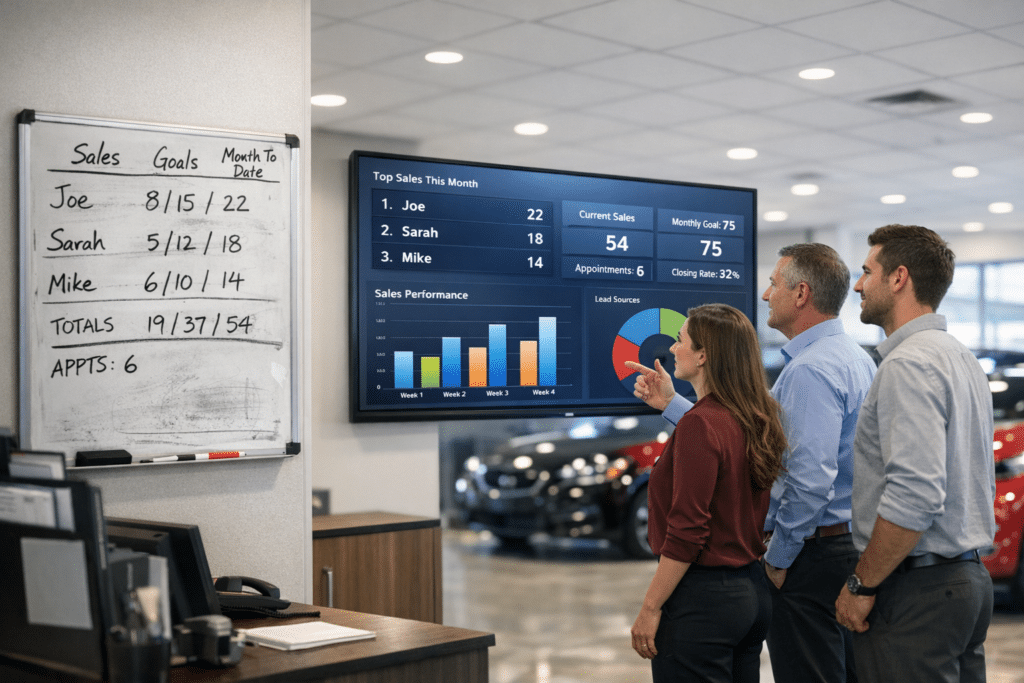
Here’s a shortcut I like a lot: real-time fixed ops leaderboards. These digital KPI dashboards update instantly, so your whole team sees rankings, sales totals, and goal progress as the day unfolds instead of weeks later.
This blog walks you through building performance boards that actually motivate your technicians and service advisors, track what matters, and turn raw data into real results.
Grab a coffee. I’ll show you exactly how your dealership can boost revenue and team morale at the same time.
Key Takeaways
- Real-time digital leaderboards update every 15 minutes, displaying repair orders, efficiency, and labor rates to boost technician accountability and save six hours weekly on reporting.
- Effective Labor Rate, repair orders, efficiency hours, and customer satisfaction index should carry 20-35% weight each on performance boards to drive meaningful business results.
- Integrating DMS data directly eliminates manual entry errors, saves 30 minutes daily, and enables immediate coaching when performance gaps appear on live dashboards.
- Gamification with badges, rotating metrics, and instant recognition increases team engagement and prevents gaming through transparent metrics, regular audits, and capped reward structures.
- A $15 increase per repair order generates $1,500 monthly revenue uplift, while 5% efficiency improvements produce measurable gains in shop profitability and customer retention.
Why Are Real-Time Fixed Ops Leaderboards Important?

Now that you know what these boards are, let’s look at why real-time fixed ops leaderboards matter so much to your service department’s success.
Your team works in a fast-paced spot where every hour counts. Real-time fixed ops leaderboards display key performance indicators every 15 minutes, giving your technicians and service advisors instant visibility into their numbers.
That timing matters more than ever. According to a 2025 Reynolds & Reynolds Fixed Ops Golden Metrics report, service volume jumped 15% year over year, but hours sold per technician grew less than half a percent. That gap shows demand alone doesn’t guarantee profit. Real-time boards close that gap by showing you exactly where efficiency slips before it drains your revenue.
This constant feedback loop changes how your staff works. Instead of waiting for monthly reports, your team sees results instantly on wall-mounted digital signage.
- Technicians see their efficiency numbers update live, which naturally pushes them to keep pace.
- Advisors track customer pay RO count and repair order mix all day, not just at month’s end.
- Managers coach in real time instead of waiting for a Friday report to spot a problem.
- Your team reclaims up to six hours a week that used to go toward manual reporting.
A suburban service center with 25 bays deployed the PULSE Mobile App to push 15-minute leaderboard updates across its signage. Before the pilot, managers spent eight hours a week on manual reporting. Six weeks after going live, that dropped to two hours weekly, and supervisor coaching interactions jumped from once a day to four times a day.
That shift from delayed reports to live data freed up leadership to focus on real coaching conversations instead of assembling spreadsheets. It’s a simple trade, and it pays off fast.
The competitive spirit these leaderboards create lifts everyone’s performance. Technicians push harder when they see peers’ numbers displayed openly, and advisors focus on average repair order value and effective labor rate because the data sits in front of them all day.
Connecting your dealership management system automates data flow, cuts out manual errors, and saves roughly 30 minutes a day. Higher throughput follows naturally when your team competes fairly. Customer satisfaction index scores climb too, because staff feel motivated to deliver better service.
Dealership profitability grows as technician productivity climbs and missed opportunities shrink. This isn’t a theory. It’s what happens when your fixed ops team can see its performance metrics in real time, every single day.
What Key Metrics Should Digital Performance Boards Display?
Your digital performance boards need to show the numbers that actually move the needle in your service department. Pick the right metrics, and your team starts chasing what matters most.
How Do Repair Orders (ROs) Impact Performance?
Repair Orders form the backbone of service department productivity, and they shape your revenue growth directly. ROs per day show volume and throughput, telling you exactly how much work moves through your shop.
Track ROs per technician and advisor in real time through your DMS, and you’ll spot performance gaps instantly. This metric carries 35% weight in most ranking structures, which tells you how much it matters.
Small improvements compound quickly. Increasing average RO value by just $15 generates $1,500 in monthly uplift. That math matters even more now that the average U.S. repair order sits around $450 in 2026, according to auto industry data compiled by Osam. When your baseline is already that high, even a small slip in performance scales into real lost revenue fast.
Take a 10-technician shop processing 200 repair orders a month. A $15 average RO increase produces $3,000 in gross monthly revenue. After you account for 20% variable cost, the net uplift lands at $2,400 a month, real money your service department can put toward training, equipment, or bonuses.
Daily leaderboard standings on your digital signage highlight ROs and spark healthy competition. Managers can compare sales per shift against historical baselines to flag deviations and dig into root causes. The leaderboard pulls straight from your DMS, so your RO count stays accurate and current.
What gets measured gets managed. This holds true for repair cycle time and customer retention alike. Technicians see their standing each morning and adjust their pace. Advisors notice which colleagues book higher-value work and pick up their techniques. The visibility turns abstract productivity into something you can actually see. Set a measurable goal, like increasing ROs by five a week, instead of a vague target. This builds accountability while keeping the high tech with high touch approach that keeps customers coming back.
Why Track Efficiency and Hours Logged?
Your technicians’ efficiency shapes your shop’s bottom line directly, and tracking hours logged shows you exactly where productivity gains hide. Efficiency compares hours worked against hours booked, showing how well your team turns labor into billable time.
This metric carries real weight on your leaderboard, at 25%. A 2025 Reynolds & Reynolds study found that dealerships giving technicians digital efficiency tracking and quoting tools sold an average of 299 more hours a month than shops still stuck on manual processes. That’s not a small bump. It’s often the difference between a shop that scrapes by and one that thrives.
Tools like Technician Tracker monitor these numbers live, giving you automated dashboards that show efficiency for each person and the team as a whole. A modest 5% improvement in flat-rate efficiency can produce real gains in shop productivity and profits.
Your technicians can check their current efficiency status any time, which links their daily work to actual rewards. That connection matters more than most managers realize.
Continuous monitoring of efficiency rates and cycle times lets you coach fast and adjust before small drifts turn into bigger problems. Hours logged data turns vague performance worries into concrete coaching moments, and conversations get a lot more productive when both sides have real numbers in front of them.
What Is the Effective Labor Rate (ELR) and Why Does It Matter?
Your service department’s profits hinge on one number: your Effective Labor Rate, or ELR. This measures the revenue quality and labor mix you generate per hour, and it shapes how much profit actually reaches your bottom line.
ELR tracks your pricing and labor allocation, showing whether technicians work on high-value jobs or spin their wheels on low-margin tasks. Think of it as your shop’s financial heartbeat. When ELR climbs, so do your service department margins.
Here’s a pitfall worth watching for. Many U.S. dealerships post a door rate of $175 an hour, but their actual collected ELR lands closer to $140. As a 2026 fixed ops profitability guide by Flai points out, that $30 to $35 gap usually comes from unmonitored discounts, exception habits, and warranty rate shortfalls quietly eating into your margins. A live dashboard catches that erosion before it becomes a habit nobody notices.
On your digital performance boards, ELR carries a solid 20% weight, signaling its importance to staff and managers alike. KPI cards display this metric for quick reads, supporting fast decisions across your fixed operations team. The PULSE Mobile App delivers real-time ELR figures so technicians and supervisors can spot trends and adjust on the fly.
Watching ELR alongside repair orders, efficiency hours, and customer satisfaction index gives you a complete performance picture. Regularly refreshed ELR data pushes timely adjustments to your pricing and rate strategy, keeping your shop competitive.
Staff members see their individual ELR contributions on digital signage, which motivates them to chase higher-value work. Independent shops and body shops benefit just as much from this transparency, since it takes the guesswork out of labor pricing decisions.
How Is Customer Satisfaction Index (CSI) Measured?

Your team’s CSI scores come directly from customer feedback collected after each repair order wraps up. The PULSE Mobile App pulls this data in real time, so scores hit your digital performance boards instantly instead of waiting for a monthly meeting.
CSI feedback captures how customers rate their whole experience, from drop-off to final handoff. Your dealership tracks these ratings by individual advisor or technician, which builds accountability that drives better service habits.
- CSI carries 20% weight in your ranking structure, same as ELR.
- The data syncs with your DMS, so numbers stay accurate and current.
- Boards display CSI alongside sales metrics, so customer-facing wins get real recognition too.
- Tracking CSI by individual staff member helps you spot coaching needs before problems grow.
This approach keeps your team’s daily actions tied to customer satisfaction goals, not just speed or volume. The brand loyalty you build through strong CSI scores turns into repeat business and a stronger customer database over time.
Real-time visibility means your fixed-ops leaderboards show the full picture, balancing customer experience with the operational numbers that drive results in the automotive industry.
How Can You Set Effective Goals and Incentives?
Setting clear targets turns your fixed ops team into a motivated, results-driven crew. Digital signage displays these goals daily, keeping everyone locked in on what matters most.
- Start with specific, measurable targets like increasing average RO value by $15 or improving flat-rate efficiency by 5%, giving technicians concrete benchmarks to chase.
- Link incentives directly to defined KPIs, creating quantifiable impacts such as a $1,500 monthly uplift from that $15 increase per repair order.
- Publish daily leaderboard standings on digital performance boards to spark healthy competition and surface performance gaps across your team.
- Reward achievement through weekly or monthly bonuses tied to team rankings, keeping motivation high all month long.
- Combine individual achievements with team goals on your signage, so technicians pull together toward shared wins instead of working solo.
- Deliver instant recognition and small rewards when team members hit key performance indicators, making praise feel real and immediate.
- Track appointments kept and no-show rates alongside other metrics, holding your scheduling process accountable while rewarding punctuality.
- Display effective labor rate progress on boards, helping technicians see how their efficiency shapes shop profitability and their own paycheck.
- Add gamification elements like badges and quick challenges tied to live results, turning daily work into engaging competition.
- Adjust goals every quarter based on actual DMS data, keeping targets realistic yet ambitious enough to push growth.
How Do You Integrate DMS Data with Digital Performance Boards?
Your Dealer Management System holds the data your team needs, and connecting it directly to your performance boards cuts out the guesswork. This turns raw numbers into live, actionable insight that drives accountability across your fixed ops department.
- Connect your DMS through third-party partnerships that Digital Dealership System offers, allowing data to flow without manual entry or extra headaches for your IT team.
- Automate daily tracking by linking leaderboards directly to your DMS, saving roughly 30 minutes a day and removing errors that slow your operation down.
- Display KPI dashboards showing repair orders, labor rates, appointments, and revenue pulled straight from your DMS in real time.
- Enable live performance metrics so technicians see their ROs and efficiency hours instantly, creating transparency across the shop floor.
- Use data-driven coaching by watching real-time DMS feeds to catch dips early, before small issues turn into big problems.
- Work with providers who offer setup support, since most leaderboard solutions integrate easily with existing dealership management systems.
- Track appointments kept and no-show rates straight from your DMS to your boards, so your team sees how scheduling affects shop productivity.
- Pull effective labor rate data automatically so technicians see how their efficiency ties to profitability and customer satisfaction index gains.
A staged rollout across three locations followed a simple five-step sequence:
- Identify the DMS API endpoints that expose the data you need.
- Map RO, hours, ELR, and CSI fields to match your leaderboard display.
- Configure 15-minute sync intervals so data stays fresh all day.
- Run a two-week parallel validation phase before going fully live.
- Enable live signage once the numbers check out.
That two-week validation caught four field mismatches that would have skewed leaderboard rankings. Fixing those mapping errors upfront cut daily manual reconciliation time by 30 minutes, freeing managers to coach instead of chase spreadsheet discrepancies.
How Can Gamification Increase Team Engagement?
Technician turnover across the U.S. automotive industry jumped 12% year over year in 2025, according to the Reynolds & Reynolds Market Pulse report. Average mechanic tenure now sits at just over three years.
That’s a tough number for any service manager. It means keeping good people matters as much as recruiting new ones, and gamification gives you a real tool for that job, not just a nice bonus.
Gamification turns your fixed ops team from passive workers into active competitors chasing goals that mean something. Badges, rewards, and team objectives boost employee recognition and spark friendly competition that keeps energy high on the shop floor.
- Live rankings on digital signage show progress and wins in real time.
- Rotating metrics, like finance products sold or customer review scores, keep the competition fresh.
- Time-bound goals and behavior-based criteria build trust, since your team can measure and control them.
- Capped rewards and measurable contributions keep the system fair and prevent gaming the numbers.
The PULSE Mobile App gives instant access to live results, so gamification keeps working even when technicians step away from the shop. Short challenges tied to live results energize daily stand-up meetings, turning routine huddles into moments of real excitement.
Technicians respond to recognition more than money alone, so celebrating wins on your digital boards matters a lot. Appointments kept and no-show rates, repair order completion times, and effective labor rates all become scorecards your team rallies around.
This approach builds accountability without feeling like punishment, because people choose to compete instead of being forced into it. Teams that embrace gamification report stronger morale and higher productivity within weeks.
Ensuring Fairness and Preventing Gaming
Your team members will find ways to game the system if your metrics lack transparency. You stop that problem by running regular audits on your DMS data and keeping your performance boards honest about what actually happened on the shop floor.
Why Are Transparent Metrics Essential?
Transparent metrics are the backbone of fair competition on your fixed ops floor. When staff see the same numbers, they trust the system. Clear data about repair orders, labor rates, appointments kept, and no-show rates clears the fog that clouds performance conversations.
Everyone knows which metrics count, how they’re weighted, and when they update. That openness stops gaming before it starts, since staff can’t argue about hidden calculations or secret formulas.
- Staff compete against the leaderboard, not against a manager’s judgment call.
- Uniform access to live data keeps competition positive across the shop floor.
- Regular audits catch inconsistencies early, so shortcuts become pointless.
- Clear rules reduce arguments about favoritism or unfair treatment.
People stop worrying about being treated unfairly. Instead, they see exactly where they stand against their peers, and the effective labor rate, customer satisfaction index, and revenue numbers speak for themselves.
Bob Gower and other industry leaders make this point often: leaderboard rules need to be clearly defined regarding which metrics count, their weightings, and update frequency. When everyone plays by the same rulebook, morale improves and performance climbs.
How Do Regular Audits Maintain Integrity?
You’ve built transparent metrics into your boards. Now you need a system that keeps those numbers honest, and regular audits are that system, catching errors before they snowball into trust issues.
- Standardized audits on shift and weekly cycles prevent data drift from creeping into your repair order counts and labor metrics.
- Real-time dashboards validate reported figures the moment they hit your system, letting you spot gaps between what’s logged and what actually happened.
- Published audit summaries keep your team confident that you’re checking numbers fairly and consistently across all locations.
- Time-bound goals and capped rewards act as guardrails, stopping technicians from pushing unrealistic efficiency rates or inflating ELR claims.
- Data integrity checks prove leaderboard rankings reflect real work, not creative accounting.
- Skill gaps show up in audit findings, pointing you toward technicians who need coaching on appointments kept rates or op-code saturation rate improvements.
- Audit results feed straight into coaching sessions, helping you tackle specific weaknesses in CSI scores or no-show patterns.
- Shift-level audits catch anomalies early, before small measurement errors turn into bigger credibility problems.
One shop saw early gaming right after its leaderboard rollout and ran a four-week audit to figure out why. The audit found 12 instances of shifted op-code usage meant to inflate efficiency, plus three appointments marked complete but rescheduled the same day.
Weekly shift audits, capped daily badge credits, and revised weighting brought gaming incidents down to zero within three weeks. Those fixes turned a struggling leaderboard into an accountability tool that technicians actually respected instead of trying to exploit.
How Do You Track and Measure Leaderboard Impact?
Tracking leaderboard impact means measuring what matters most to your bottom line and your team’s growth.
| Measurement Strategy | How to Track It | Real Impact |
|---|---|---|
| Revenue Per Repair Order (RO) | Monitor average dollar amounts generated per RO every 15 minutes through your DMS integration. Compare current month against previous months. Small gains matter; a $15 increase per RO generates $1,500 monthly revenue for typical dealerships. | Direct profit increase. Teams see their work translating to dollars. Motivation rises when technicians and advisors understand the connection. |
| Technician Efficiency Metrics | Track hours logged against actual work completed. Real-time KPI displays on wall-mounted screens show who’s hitting efficiency targets. Data updates continuously, not weekly or monthly. | Managers reclaim up to six hours weekly on administrative tasks. Technicians get immediate feedback. Corrective actions happen faster when performance gaps appear. |
| Effective Labor Rate (ELR) Growth | Pull ELR data from your DMS each day. Chart trends across departments. Storewide dashboards help everyone understand labor profitability, not just leadership. | Labor costs become transparent. Teams own their contribution to shop profitability. Ownership mentality develops when people see real numbers. |
| Customer Satisfaction Index (CSI) Correlation | Compare CSI scores month over month. Cross-reference high CSI performers with leaderboard rankings. Identify if top revenue generators also maintain service quality or if shortcuts damage relationships. | Prevents gaming the system. Shows whether your team balances speed with customer care. Quality matters as much as throughput. |
| Sales Per Shift Analysis | Establish historical baseline data for each shift. Compare current performance against past weeks and months. Track morning versus afternoon patterns. Identify which shifts outperform others consistently. | Reveals scheduling opportunities. Shows which teams perform best at specific times. Data guides shift assignments and staffing decisions. |
| Top and Lagging Performer Identification | Managers spot high performers and struggling team members within minutes. Digital performance boards highlight who needs coaching instantly. No guessing required. | Targeted coaching replaces generic training. Resources go to people who need support. High performers get recognized quickly, reinforcing their behavior. |
| Leaderboard Engagement Metrics | Track how often team members check the boards. Monitor shift-to-shift competition levels. Measure participation rates in performance discussions. Survey staff monthly on whether leaderboards motivate them. | Engagement directly correlates to performance. Low board viewership signals declining interest. High engagement suggests your metrics matter to your team. |
| Goal Achievement Rates | Set specific monthly targets for RO count, revenue, efficiency, and CSI. Track percentage of team members hitting goals. Measure how many goals get exceeded versus missed. | Shows whether your goals are realistic and motivating. Consistently missed targets signal goals are too aggressive. Consistently exceeded targets suggest raising the bar. |
| Audit Trail Documentation | Maintain records of all leaderboard data pulled from your DMS. Document any adjustments or corrections. Create a monthly audit report that verifies data accuracy and flags any anomalies for review. | Builds trust in the system. Prevents disputes about historical performance. Creates accountability for both staff and management when numbers are questioned. |
How Can Leaderboards Be Scaled Across Departments and Locations?
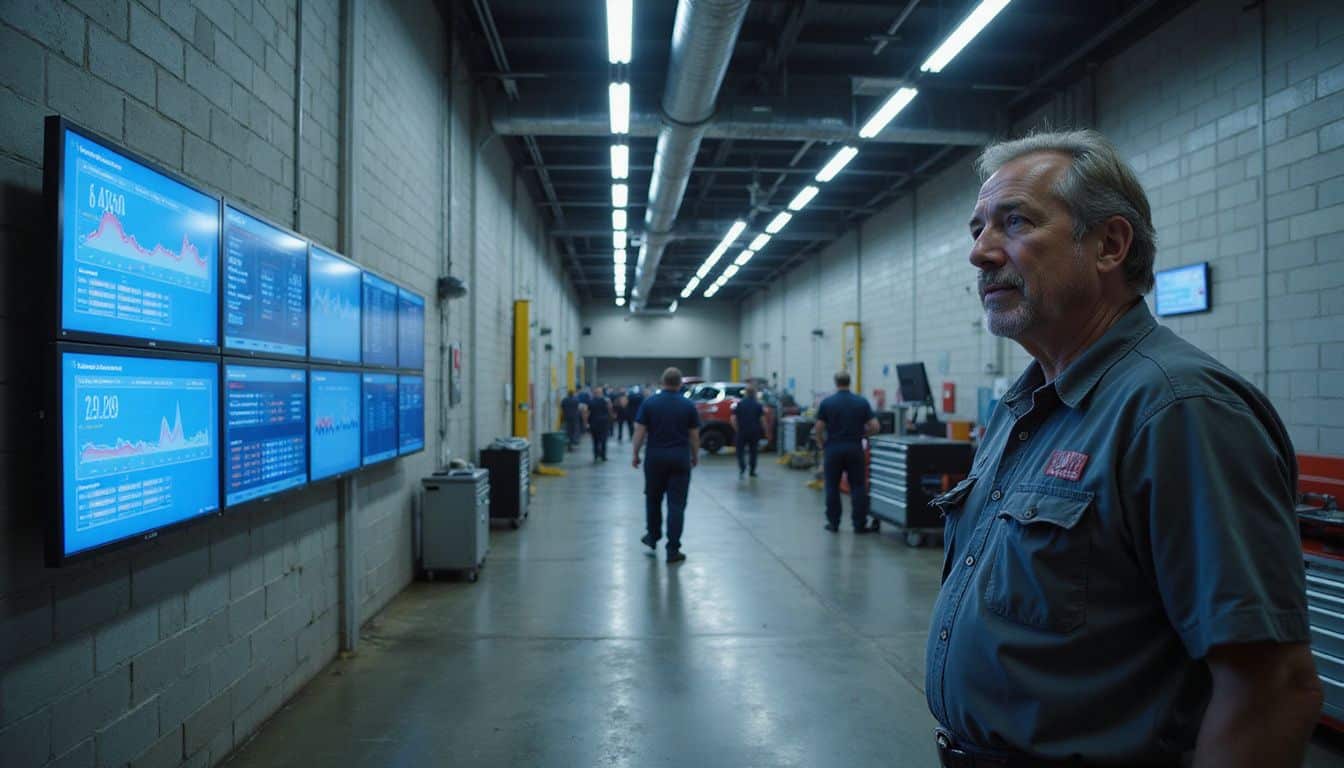
Your fixed ops team grows fast, and your digital signage needs to keep pace. Scaling leaderboards across multiple stores and roles gives you centralized KPI visibility that managers can access instantly.
- Deploy the PULSE Fixed Ops Leaderboard system across all your locations to keep metrics consistent and enable quick cross-store comparisons.
- Customize digital sign solutions for both large and small dealerships, so your boards fit your space and budget without breaking the bank.
- Access the full-featured backend to adjust dashboards as your operations grow, adding new departments and roles without starting from scratch.
- Tailor dashboards for individual roles and departments, so technicians see what actually matters to them.
- Track repair orders, efficiency hours, effective labor rates, and CSI metrics uniformly across all stores using centralized data integration.
- Leverage mobile app access so team members and managers monitor KPIs in real time from any store or department.
- Integrate your DMS data directly into performance boards to eliminate manual updates and cut errors.
- Compare appointments kept and no-show rates across locations to spot which stores excel at scheduling and which need coaching.
- Monitor op-code saturation rate at each dealership to spot bottlenecks and redistribute work before problems compound.
- Use centralized dashboards to promote fair competition between locations, letting each store see how it stacks up while celebrating wins together.
What Are Best Practices for Coaching and Training Using Data?
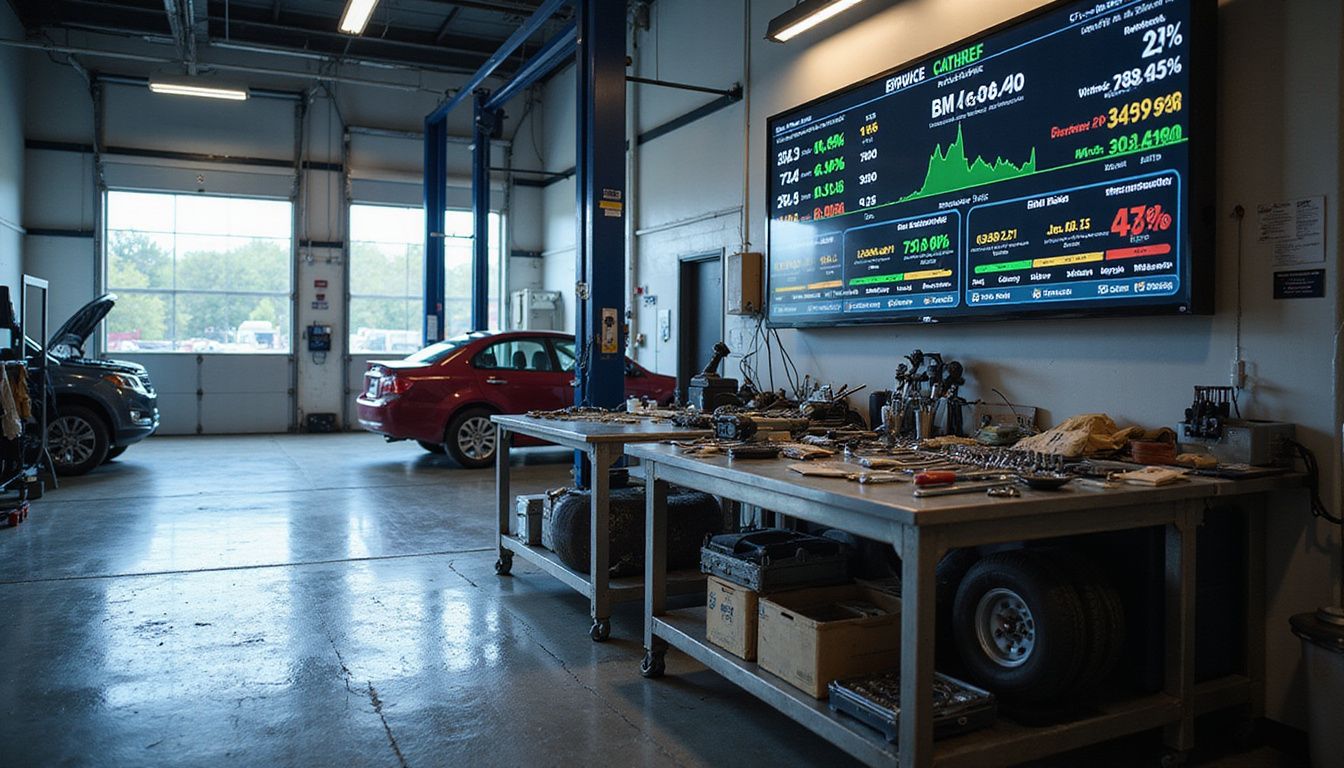
Data turns coaching sessions into real growth opportunities for fixed ops teams. Live performance boards give managers the tools to guide staff toward actual improvement.
- Pull up real-time metrics during quick stand-up meetings and use those numbers to spark conversations about what’s working and what needs fixing.
- Run one-on-one coaching sessions with staff, reviewing their repair order completion rates and efficiency metrics to spot specific skill gaps.
- Set clear next steps based on performance data, so each team member knows exactly what actions will move their numbers.
- Pair consistent feedback with quick recognition when technicians hit targets or improve their effective labor rate and hours logged.
- Use appointments kept and no-show rate data to coach front desk staff on scheduling practices that reduce gaps and boost capacity.
- Run performance audits regularly to catch patterns in CSI scores, then address root causes through targeted training.
- Use benchmarking during coaching talks to spark healthy competition, showing teams how their op-code saturation rate stacks up against department standards.
- Display live boards in visible areas so staff adjust behavior in real time instead of waiting for monthly reviews.
- Build simple habits around data review, checking metrics before shifts start so coaching stays fresh and actionable.
- Track improvement over time using your DMS integration, celebrating wins and adjusting coaching strategies when metrics plateau.
How Do You Build Long-Term Accountability and Team Morale?

Your fixed ops team thrives when accountability becomes a shared value, not a punishment tool. Public recognition from managers turns leaderboard results into real motivation, since your technicians and advisors see their names displayed in high-traffic spots like break rooms and main offices.
Instant rewards for hitting KPIs matter a lot here. Your team needs quick praise and visible acknowledgment when they hit a target, and that momentum builds lasting morale better than annual bonuses ever could.
- Clear rules and transparent metrics keep results visible and top of mind for everyone.
- Continuous feedback from your boards enables quick corrective action and a culture of ownership.
- Goals refreshed from live analytics keep the team focused on near-term wins.
- Gamification that celebrates both team and individual wins prevents burnout from constant competition.
Your appointments kept and no-show rates, repair order volume, effective labor rate, and CSI all deserve a spotlight moment on your boards. Sales conversion metrics and op-code saturation rate improvements deserve recognition too, since every role contributes to the dealership’s success.
Consistent engagement with these boards turns performance numbers into results your staff actually cares about. Long-term morale grows when your people see the direct line between their daily effort and the recognition they get for it.
Conclusion
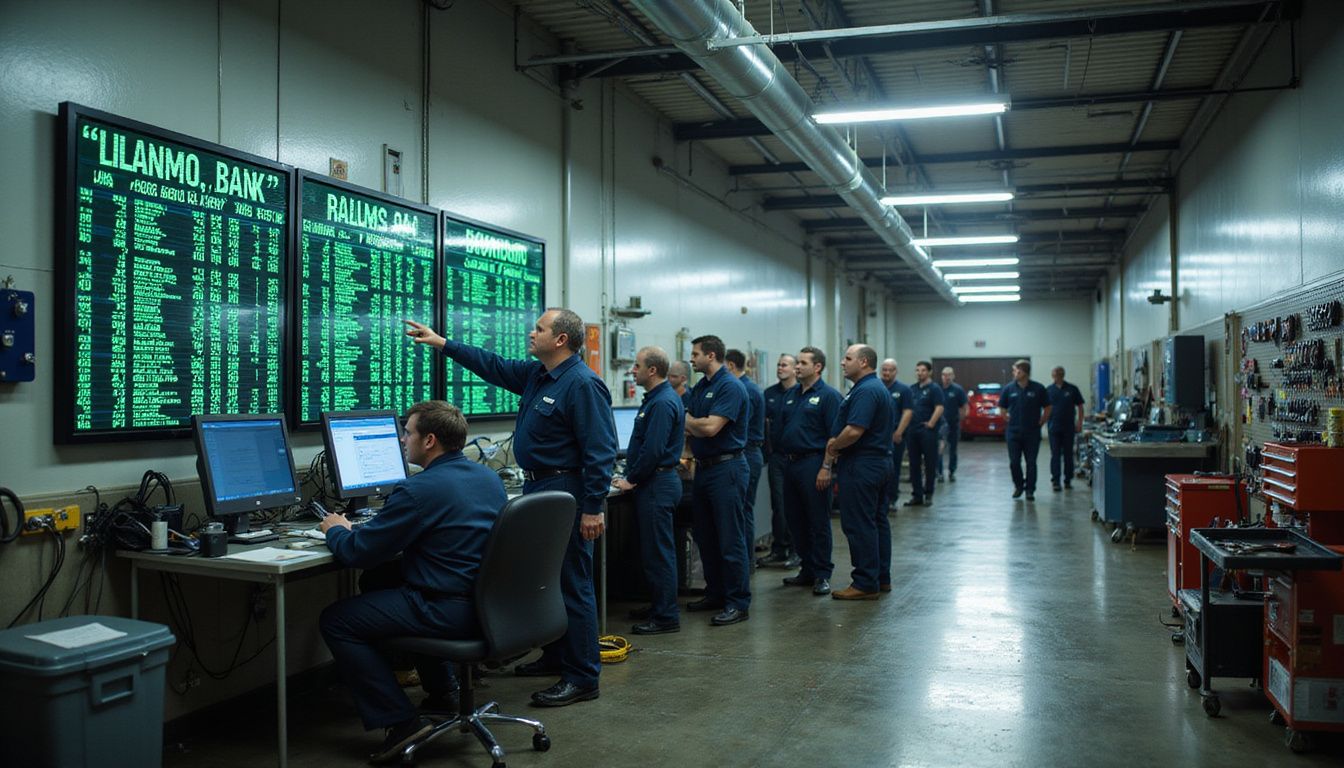
Digital performance boards change how fixed ops teams work. They turn data into action and motivation into results.
When technicians and service advisors see their metrics update every 15 minutes, they stay locked in on what matters: hitting targets and serving customers well.
Real-time visibility cuts through the noise. Your team knows exactly where it stands without waiting for a monthly report or guessing.
Small wins add up fast, too. A $15 boost per repair order turns into serious money once you multiply it across your whole department.
Start with one high-traffic location, track what moves the needle, and watch your fixed ops culture shift from reactive to proactive, one leaderboard at a time.
FAQs
1. What is a digital performance board, and why does it matter for fixed ops?
A digital performance board shows real-time numbers like op-code saturation rate, appointments kept, and no-show rate where your whole team can see them. When techs and advisors watch their scores update throughout the day, they stay competitive and locked in. Traver Connect builds these boards specifically to keep fixed ops teams focused on what moves the needle.
2. How does op-code saturation rate actually help a service department?
Op-code saturation rate tracks how many services you’re selling per repair order. Catch the missed brake jobs and alignments daily, and you’ll stop leaving thousands on the table each month.
3. Why should dealers care about appointments kept and no-show rate?
Empty bays from no-shows mean direct lost revenue, and they mess up your schedule for everyone else. Ryan Carlstedt has talked about this on Daily Dealer Live, explaining how tracking these metrics helps teams tighten their follow-up and reduce broken appointments.
4. Where can dealers learn more about this kind of digital marketing strategy for fixed ops?
Shows like All Things BDC and Daily Dealer Live cover real dealership examples, and you can follow CarDealershipGuy and WillisAutos on Instagram for quick tips. Between podcasts, social posts, and OEM parts training, you’ll find plenty of ways to sharpen your fixed ops approach.