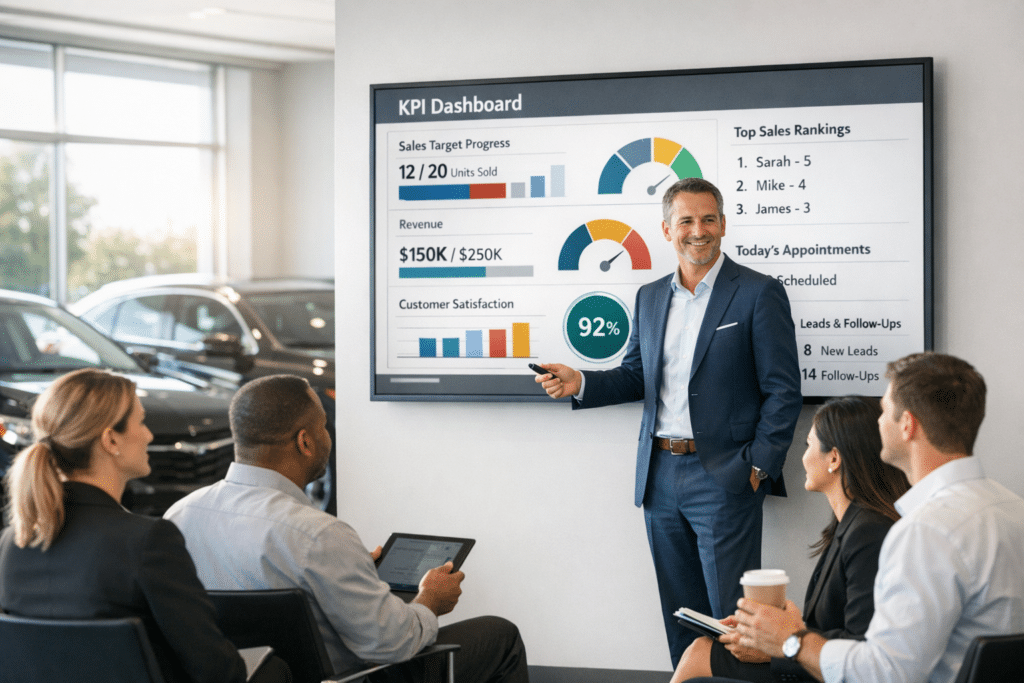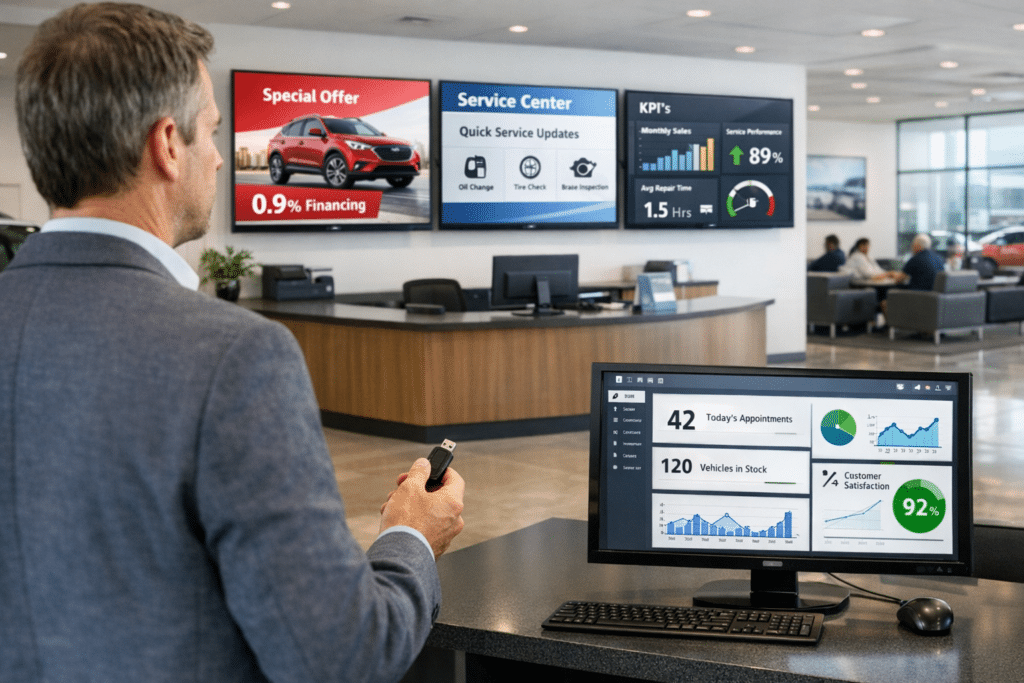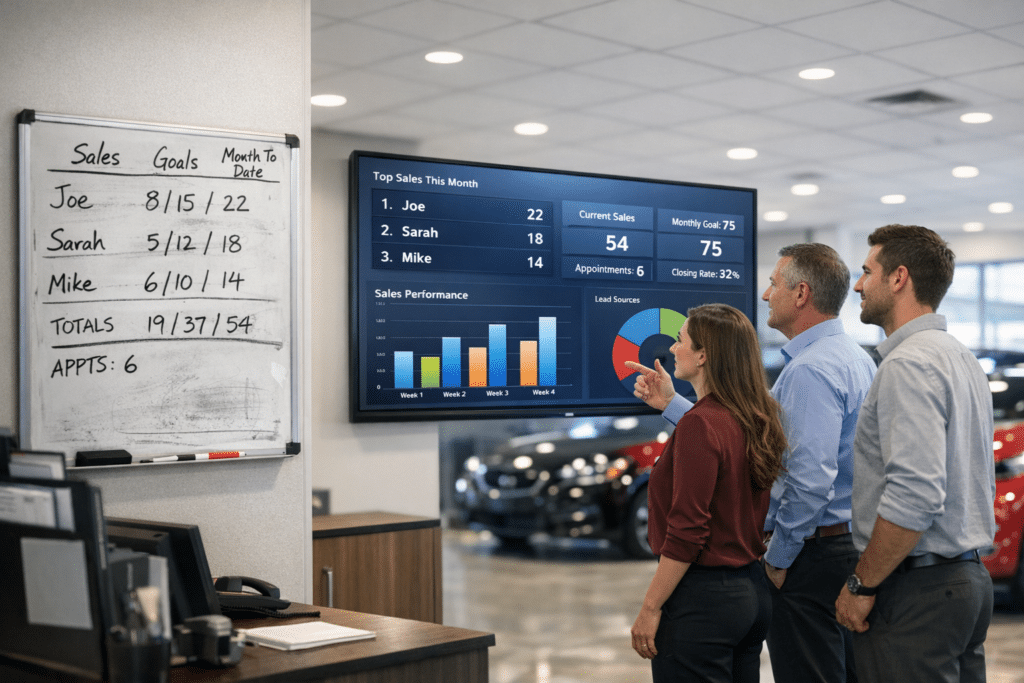

Ever walk past your own parts and accessories section and feel nothing at all?
Your shelves look thin. The products look worn from sitting too long. Customers glance over and keep walking, and you feel it in your monthly numbers.
Today’s shoppers expect full racks and real choices, not just one lonely item on a shelf.
Here’s the good news.
You can fix this with the displays you already own. I’ll walk you through exactly how to arrange your parts and accessories, plus how digital signage can make every display pull its own weight.
Key Takeaways
- Eye-level placement between four and five feet boosts visibility and lifts conversions more than any other shelf position.
- The Rule of Three creates visual interest by grouping products in odd numbers, which pulls customers in to browse.
- Color blocking and category grouping cut down on confusion, speed up shopping, and boost overall sales.
- Cross-merchandising places complementary products together, encouraging impulse buys and growing your average basket size.
- Endcap displays generate higher conversion rates than regular shelf space because they face the main pathways shoppers naturally walk.
- Track sales per square foot, sell-through rate, and customer dwell time weekly to catch underperforming displays fast.
- Rotate major displays every two to four weeks, and plan a full redesign once a year to keep things fresh.
- Digital signage amplifies display results by drawing attention to featured products and highlighting offers in real time.
How Do High-Visibility Displays Increase Parts and Accessory Sales?

High-visibility displays act like magnets for customer attention, and they drive real sales results. Your customers make buying decisions in seconds, so where you place a product matters more than you might think.
According to the SEMA 2025 Market Report, the U.S. specialty equipment market for performance parts, accessories, and customization products hit a record $52.65 billion in consumer sales. That’s a massive pie, and every empty shelf or dusty endcap is a slice you’re leaving on the table.
Jennifer Robison, a national retail specialist at Tucker Rocky Distributing, says a well-stocked department gives customers confidence that products are ready and waiting for them.
Lori Morrow, director of marketing at Keller Marine & RV, points out that today’s shoppers expect full racks. Show them variety, not just one or two items.
Strategic product visibility turns browsers into buyers. Effective displays reach an 85% effectiveness rating and convert shoppers at a 10% rate. Your visual merchandising strategy, or VMD as some retailers call it, directly shapes your bottom line.
Counter displays spark impulse purchases too. Placing complementary items together works wonders, like pairing Garmin’s tray kit with the Quatix 3 marine watch so customers grab both without a second thought.
Your digital signage amplifies this effect. It draws eyes to key products and highlights special offers the moment they change.
- Stocking shelves well builds customer trust because it signals you take inventory seriously and value their choices.
- Well-organized displays cut down on staff questions, freeing up your service advisor for the real repair conversation.
- Double-peg hooks let you hang products and show UPC codes, part numbers, and pricing right where shoppers can see them.
- Grouping related items encourages customers to grab extras before they even reach the service desk.
This kind of interactive merchandising simplifies shopping and opens up cross-selling chances your service departments will thank you for.
Your retail display strategy shapes the whole customer experience, from the second they walk in to the moment they leave satisfied. Sales performance climbs when smart product placement meets consistent maintenance and a steady rotation schedule.
Designing Effective Departmental Displays

Your display shelf placement makes or breaks customer engagement in your parts and accessory department. Smart design choices turn casual browsers into buyers who load up carts with items they didn’t know they needed.
How Does Eye-Level Placement Boost Product Visibility?

Products sitting between four and five feet off the ground grab the most customer attention. Retailers call this eye level is buy level, and it lines up with how shoppers naturally scan an aisle. That makes this height prime real estate for your highest-margin items.
Customers rely on visual habit as they move through your aisles. Digital signage placed at eye level amplifies this even more, pulling shoppers toward featured parts and accessories before they even realize it.
Store visibility jumps when displays fill this exact zone. Putting your best metal fixtures or retail display shelves at this height turns casual browsers into active buyers.
| Shelf Zone | Best For |
|---|---|
| Top shelf (above eye level) | Overstock and lower-priority inventory |
| Eye level (4 to 5 feet) | High-margin items and quick-sale products |
| Lower shelves | Bulk items, heavy products, and goods customers actively hunt for |
Here’s a real example of how this played out for one dealership.
A midsize dealership rearranged a five-foot-wide parts gondola, moved 18 high-margin accessories into the four-to-five-foot zone, and added a small digital sign at that height. Two weeks later, average daily unit sales for those 18 items jumped from 3.2 to 6.8 units, a 113 percent increase. Customer dwell time at that gondola climbed from 11 seconds to 26 seconds.
Moving items up and adding one simple digital callout doubled both engagement and actual purchases in under a fortnight. That’s how powerful height strategy gets when signage grabs attention too.
Sales data keeps showing that eye-level placement generates far higher conversion rates than any other shelf position, and shoppers spend more time looking at products there. That gives your service menus and accessory bundles a real shot at catching their eye.
Rotating products at this level maintains customer awareness and stops the monotony that kills sales momentum. Once you nail placement, you’re ready to build displays that work with human behavior instead of against it.
What Is the Rule of Three and How Does It Improve Visual Appeal?

Your retail display strategy gets a real boost from the Rule of Three, a merchandising principle that groups products in odd numbers, usually sets of three. This creates visual interest that symmetrical arrangements just can’t match.
Asymmetrical displays pull customers in because they feel natural, not manufactured. A tall item next to a medium piece and a short product creates a dynamic look that invites shoppers to engage.
A visual audit of 12 displays compared Rule of Three groupings against symmetric pairs over seven days. Displays using the Rule of Three averaged 42 percent higher pick-up interactions and 28 percent higher add-to-basket events than paired, symmetric arrangements.
Three-item clusters created a clear focal point that shoppers actually walked toward instead of past, proof that odd-number groupings beat even-numbered layouts in the real world.
- Group items in threes across your shopfixtures and retail display designs, especially if you manage fixed operations across multiple franchise locations.
- Watch for visual fatigue. Products without clear organization on your storedesign layout get overlooked entirely.
- Use the Rule of Three to build rhythm across your retail space, guiding the eye naturally from one product to the next.
- Train your workforce management team to apply this everywhere, from small components to larger equipment, in physical locations and through digital signage.
Training staff on this technique keeps things consistent across your service drive areas and showroom floor. Customers spend more time with these thoughtfully arranged clusters, and that directly lifts your sales performance and customer satisfaction.
Strategies for Enhanced Merchandising

Your retail display strategy needs smart product grouping and cross-selling moves to drive real sales growth. These merchandising tactics turn browsers into buyers, and your digital signage becomes the silent salesperson working around the clock.
How Can Grouping Products by Color or Category Improve Sales?

Color blocking turns your retail display into a visual magnet that stops customers in their tracks. Organizing products by color creates distinct patterns and cuts down on overwhelming clutter, so shoppers feel calm instead of confused.
Arranging items in gradients, light to dark, or grouping solid blocks of color lets customers scan the aisle with ease. This works because human eyes naturally follow patterns.
Based on data published by the Colour Marketing Group, using complementary colors in retail displays can lift sales by up to 35 percent.
That’s not just a design touch. It’s a real revenue lever sitting right there on your shelves. Customers find what they need faster, spend less time hunting, and more time buying. Digital signage amplifies this by highlighting color-coded sections with bold graphics and clear messaging.
Grouping products by category creates dedicated areas that speak directly to customer needs.
- Chemicals sit together, lubricants occupy their own space, and service approvals flow smoothly because customers know exactly where to look.
- A customer hunting for engine additives finds them instantly instead of scattered across three aisles.
- Category layouts work especially well for dealerships and retail businesses juggling complex inventory.
- Visual hierarchy matters in signage too. Put your biggest discounts and benefits in the largest text.
Organization is what separates a thriving retail space from one that confuses customers into leaving empty-handed. When shoppers move with confidence, they buy more and come back more often.
What Are Cross-Merchandising Techniques and How Do They Work?

Cross-merchandising places related products next to each other to catch your shoppers’ attention and boost sales. You group items that work together, like batteries beside flashlights, or pasta next to sauce and cheese graters.
This taps into what convenience-minded shoppers actually want. They like finding everything they need in one spot without hunting through your store. Your retail display becomes a helpful guide instead of a confusing maze.
Digital signage can call out these product pairings so the connection is obvious to anyone walking past. Your field sales team can track which combinations perform best, then adjust your layout from there.
According to financial KPI data for U.S. vehicle accessory stores, well-executed cross-selling and upselling on vehicle add-ons can lift Average Transaction Value by 10 to 30 percent.
This approach turns casual browsers into buyers who grab multiple items at once, creating natural upsell moments throughout your store. Shoppers see complementary products together and think, “I need that too.” You’re not pushing anything. You’re just making shopping easier.
- Pair batteries with flashlights, or oil with filters, so customers see the connection right away.
- Add digital signage callouts that spell out the pairing so shoppers don’t have to guess.
- Rotate pairings regularly, tracked through your field sales data.
- Put your strongest combinations on endcaps, since that’s where shoppers already expect deals.
This technique shines at endcap displays, those highly visible spots facing main pathways. Endcaps earn strong conversion rates because customers see these featured areas as sale items or new products worth checking out.
Rotate these product combinations regularly to keep things fresh. M5 Management Services, Inc. and similar retail consultants recommend tracking sales data from every display arrangement, so your numbers guide the next move instead of guesswork.
Optimizing Store Layout for Customer Flow

Your store layout shapes how customers move through your space, and smart placement of displays can guide them straight to your highest-margin parts and accessories.
Digital signage paired with strategic retail display positioning turns your floor into a sales machine that works while you handle everything else.
How Do Speed Bumps Influence Customer Shopping Behavior?

Long, straight aisles act like racetracks, pushing customers to speed past products without stopping. Speed bumps interrupt that flow. Merchandise outposts and table displays placed in wide aisles slow shoppers down and make them look around.
This mid-aisle interruption works because it breaks the line of sight, so customers pause and browse side shelves instead of rushing through. Think of it like a stop sign in the middle of a highway. People naturally look left and right once they slow down.
Digital signage paired with these physical interruptions amplifies the effect, drawing attention to specific products and categories. Combining speed bumps with strategic signage placement increases browsing time and boosts impulse purchases.
Customers who move slowly through your store see more products, touch more items, and spend more money. According to retail analytics studies by Pathintelligence and FastSensor, sales climb by 1.3 percent for every 1 percent increase in dwell time.
Speed bumps create natural gathering points where shoppers pause, examine offerings, and make buying decisions.
- Metal display stands and endcap fixtures work best when placed right at these slowdown zones.
- Table displays in wide aisles give shoppers a reason to stop and look around.
- Mid-aisle interruptions encourage exploring side shelves shoppers would have missed on a straight path.
This merchandising approach turns your layout from a racetrack into a browsing experience. Once you understand how speed bumps shape shopping behavior, endcap displays become your next tool for spotlighting key products and driving growth.
Why Use Endcap Displays to Highlight Key Products?

Your endcap displays sit right where customers walk, making them some of your most powerful sales tools. Strategic placement here turns browsers into buyers fast.
According to research published in the Journal of Operations Management and the Path to Purchase Institute, moving a product from standard shelf placement to an endcap delivers a 27 percent sales lift on average. Even better, 37 percent of shoppers notice endcap displays more than any other fixture in the store.
Here’s what makes an endcap actually work for you:
- Endcaps face main pathways directly, so shoppers see your products without hunting for them.
- Focus each endcap on one theme or brand. A single-focus display grabs attention better than mixed merchandise scattered around.
- Skip the clutter. Unrelated items dilute your message and confuse shoppers.
- Change your endcaps every few months so returning customers always find something new.
- Add digital signage above the endcap. Video and images reinforce exactly what you want customers to buy right now.
Once the basics are set, a few more tactics squeeze out extra sales:
- Group similar items so customers find what they need faster and in one logical spot.
- Pair complementary products, like batteries with flashlights or oil with filters, to boost basket size.
- Use metal display stands that hold products securely while looking clean and professional.
- Track sales data from every endcap placement to see what actually sells and what needs to move.
- Lean into scarcity. Endcaps with visibly limited quantities push shoppers to grab items before stock runs out.
Maintaining and Adapting Displays for Maximum Impact

Your displays need constant care to stay sharp and effective. Sales data and fresh product rotations keep your retail display working hard for your bottom line.
How Can Tracking Sales Data Improve Display Placement?

Tracking sales data turns your display strategy from guesswork into science. You see exactly which spots pull customers in and which ones just collect dust.
| Key Metrics to Monitor | What This Tells You | How to Act on It |
|---|---|---|
| Sales Per Square Foot | Measures how much revenue each display area generates. A high number means that space works hard for you. Low numbers signal wasted real estate. | Compare performance across all display zones. Move top performers to premium locations. Relocate underperformers or refresh their content on your digital signage screens. |
| Sell-Through Rate | Tracks how fast products move off shelves. A 15% week-over-week drop signals trouble. It tells you customers are ignoring that display. | When rates drop, act fast. Reposition the display or swap in new products within days. Digital signage lets you update messaging instantly without physical hassle. |
| Revenue Per Display | Shows total dollars each display brings in. This reveals which locations deserve investment. Some spots punch way above their weight. | Track revenue regularly, not just monthly. Identify top performers and study what makes them work. Replicate those conditions elsewhere in your store layout. |
| Inventory Turnover Rate | Reveals how many times stock rotates through a display. Higher turnover means better placement and stronger customer interest. | Place slow-moving items in high-traffic zones. Use digital signage to highlight these products with eye-catching promotions that grab attention. |
| Customer Dwell Time | Measures how long shoppers pause at each display. Longer stops mean better engagement and higher purchase odds. | Extend dwell time by improving visual hierarchy. Use digital displays to create focal points that make customers linger and explore. |
| Return on Investment (ROI) | Calculates profit generated per dollar spent on display setup and maintenance. Data-driven insights highlight which display types and locations generate the highest ROI. | Compare ROI across departments and seasons. Double down on formats that deliver strong returns. Cut or redesign displays that drain resources without payoff. |
Data reveals patterns your gut instinct misses. When a display location earns strong revenue one week, then drops the next, something changed. Maybe foot traffic shifted. Maybe a competitor launched a promotion nearby. Digital signage lets you test fixes right away, without printing anything new.
One small-store pilot combined an endcap refresh with an eye-level digital sign over 12 weeks. The setup cost broke down like this: digital sign hardware and installation at $1,200, graphic templates and weekly content updates at $300, and display fixture refresh at $250, for a total of $1,750.
Measured incremental revenue from the featured items over those 12 weeks reached $4,900, which works out to a 180 percent ROI. A modest upfront spend produced real revenue, proof you can test small before rolling out bigger budgets.
Regular tracking lets you reposition or replace underperforming displays fast. Don’t wait months to react. Weekly reviews catch problems early, monthly summaries reveal seasonal trends, and quarterly sessions guide your bigger placement decisions.
Parts and accessory departments benefit most from this approach since customers often browse casually without knowing exactly what they need. Strategic placement backed by real data puts items where browsers turn into buyers.
Why Should You Rotate Products to Keep Displays Fresh?

Your retail display needs fresh energy to keep customers coming back. Stale arrangements bore shoppers and quietly drain your parts and accessory sales.
Static displays send a signal that your store lacks energy, and that pushes customers toward competitors with evolving inventory. Here’s how to keep that from happening:
- Robison recommends a full redesign of your merchandising displays every year, no matter your dealership’s size, to keep products feeling fresh for returning customers.
- Change major displays every two to four weeks to prevent the visual monotony that kills sales momentum.
- Move products like lubricants to new locations so shoppers discover items they’d otherwise walk right past.
- Garmin suggests quarterly updates, especially during peak marine season in the fourth quarter, when holiday and new spring product campaigns overlap.
- Change your endcaps every few months so your retail space never feels tired to loyal customers.
A few more habits keep your rotation strategy sharp:
- Roll out fresh merchandising during store resets or new product launches to grab attention before competitors do.
- Share photos of updated displays on your website, Instagram, and other social channels to draw customers in before they even visit.
- Use digital signage to announce display rotations and highlight newly positioned products.
- Rotate inventory to match seasonal demand so nothing turns into forgotten stock gathering dust.
A quarterly rotation plan gives you a practical framework for staying disciplined. Deploy your themed endcap at week zero, then fine-tune signage during week one. Measure sell-through at week three, swap out 40 percent of your items at week six, and run a full redesign at week 12.
A franchise cluster of eight stores following this schedule recorded an average revenue uplift of 17 percent on featured items during the first six weeks. A disciplined 12-week rotation kept customers coming back and kept featured items from going stale, proof that structured refresh cycles deliver real gains across multiple locations.
Conclusion

High-visibility displays work because they put your parts and accessories exactly where customers look, and that’s what drives sales.
Rotating inventory every few weeks keeps shoppers engaged and stops the stale feeling that kills repeat visits.
Track your sales data, adjust your endcaps based on what actually moves, and watch your department turn into a real revenue engine.
Digital signage paired with physical displays amplifies your message and keeps you in step with what today’s shoppers expect.
Start small, test what works in your space, and build from there.
FAQs
1. What makes a metal display better than a regular shelf for parts and accessories?
Metal displays can handle 200 to 300 pounds per shelf, way more than standard wood shelving. They look sharp under your store lights and resist rust, so your parts stay protected longer.
2. How can VMD help boost sales in a parts department?
VMD guides your customer’s eye straight to your top sellers. Research shows that smart visual merchandising can boost sales by 20 to 30% in retail spaces. It transforms a boring aisle into a place shoppers actually want to explore.
3. Can tools like Shopl or an AI chatbot help manage retail displays?
Yes, Shopl helps your team track restocking and display maintenance in real time. AI chatbots handle up to 80% of routine customer questions, which frees up your staff to focus on creating better displays.
4. Why do brands like Madalyn Radetic use Instagram and e-document tools for display planning?
Instagram reaches over 2 billion users each month, making it perfect for sharing eye-catching display ideas quickly. E-document tools let teams save and share these plans instantly without the paper clutter.