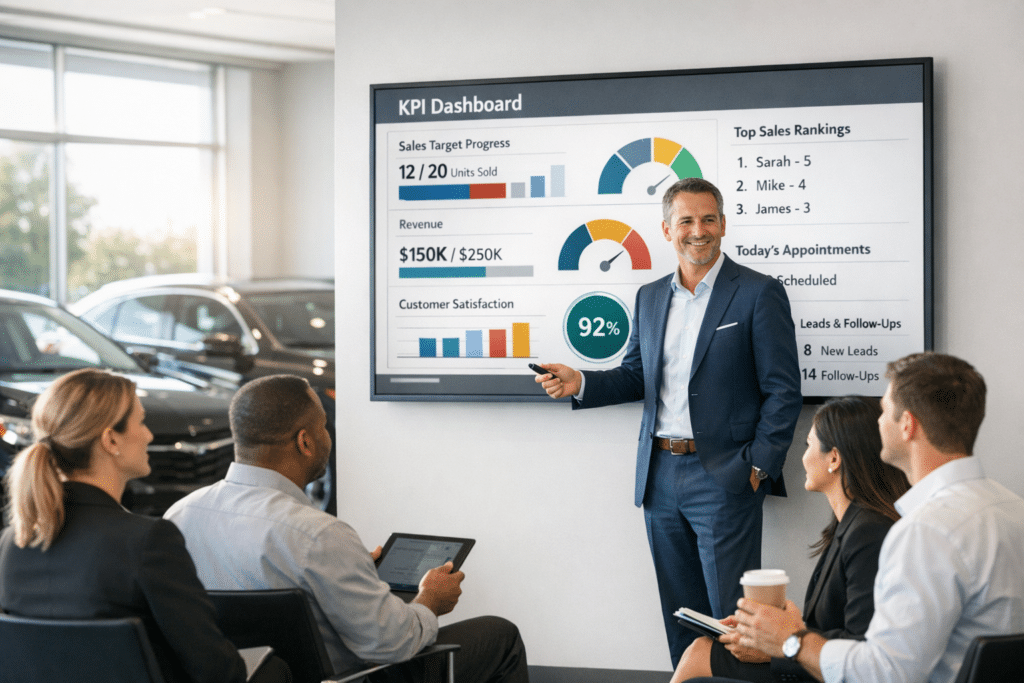
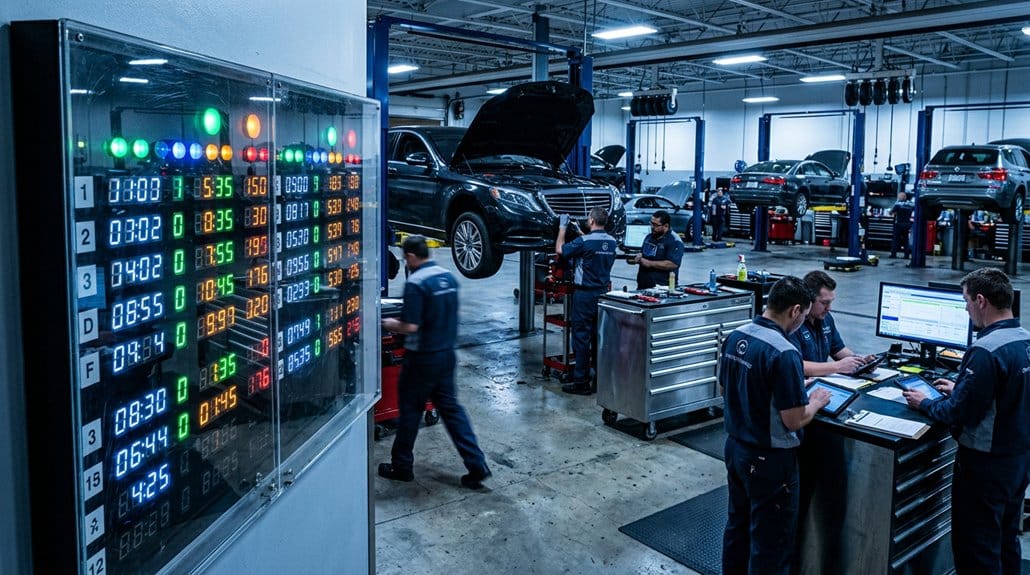
You’ll drive faster, measurable accountability by displaying real‑time fixed‑ops leaderboards that refresh every 15 minutes, surfacing ROs, technician efficiency, ELR, CSI and hours worked. With DMS integration and digital signage, data flows automatically so you can spot trends, correct course, and reduce manual reporting errors. Transparent ranking rules, audits and gamified guardrails prevent gaming while motivating staff. You’ll see daily behavior shift toward productivity and quality, and you can scale results across stores — keep going to learn implementation specifics.
Key Takeaways
- Live leaderboards display KPIs every 15 minutes, making current performance instantly visible and actionable for staff.
- Automated DMS integration eliminates manual reporting, ensuring accurate, timely data that builds trust and accountability.
- Clear, published ranking rules and weighted metrics prevent ambiguity and encourage fair competition among team members.
- Real-time metrics enable immediate coaching and course correction, driving daily behavioral changes and productivity gains.
- Regular audits and guardrails (timebound goals, capped rewards) prevent gaming and maintain performance integrity.
What Real‑Time Fixed‑Ops Leaderboards Are and Why They Matter
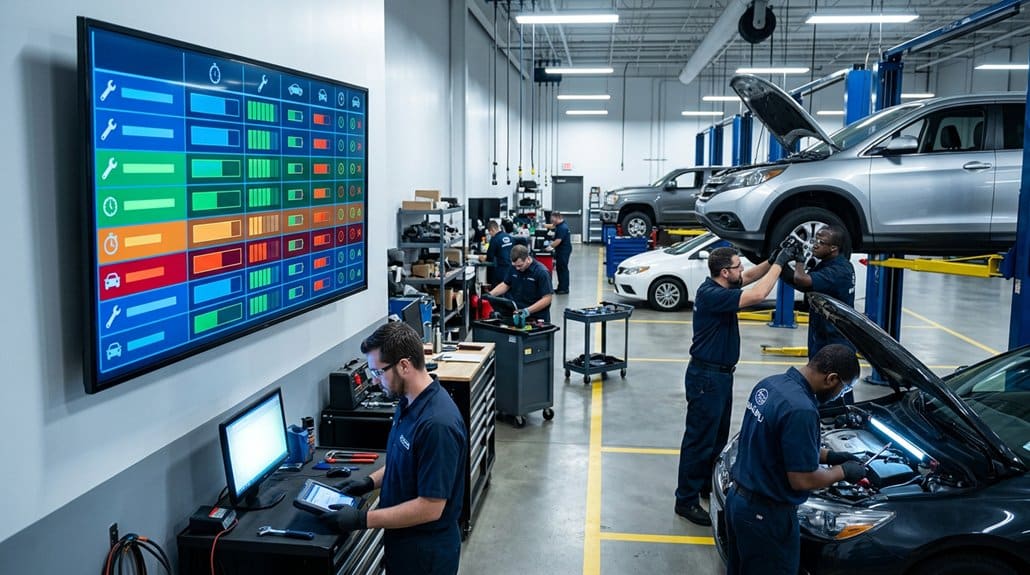
Think of real-time fixed‑ops leaderboards as a live dashboard for your service department: they surface KPIs like ROs, efficiency, and sales and refresh every 15 minutes so advisors and techs always see current performance. You’ll get real time updates that remove lag between action and insight, facilitating immediate performance tracking and faster corrective coaching. Integration with your DMS guarantees data flows automatically, cutting manual report time and freeing staff for revenue-generating tasks. Visible, up-to-the-minute metrics drive accountability—team members see results, compare against targets, and adjust behaviors in real time. Over time you’ll identify trends, pinpoint coaching opportunities, and sustain engagement through transparent goals. The result is measurable improvement in operational efficiency and sales productivity.
KPIs to Display: ROs, Efficiency, ELR, CSI, Hours
Metrics matter: a real-time fixed‑ops leaderboard should surface ROs, technician efficiency, Effective Labor Rate (ELR), CSI, and hours worked so you can see daily volume, productivity, revenue quality, customer experience, and staffing utilization at a glance. You’ll monitor RO Trends to spot volume shifts and prioritize workload. Efficiency Boosts come from tracking tech utilization and comparing actual vs. booked hours to tighten throughput. ELR Insights reveal pricing and mix issues that affect profit per hour. CSI Strategies focus on immediate feedback loops so advisors correct service delivery before scores drop. Productivity Metrics like hours worked and ROs per tech create transparent targets, drive healthy competition, and let you quantify gains in revenue, utilization, and customer satisfaction in real time.
Set Fair Ranking Rules for Scoreboards
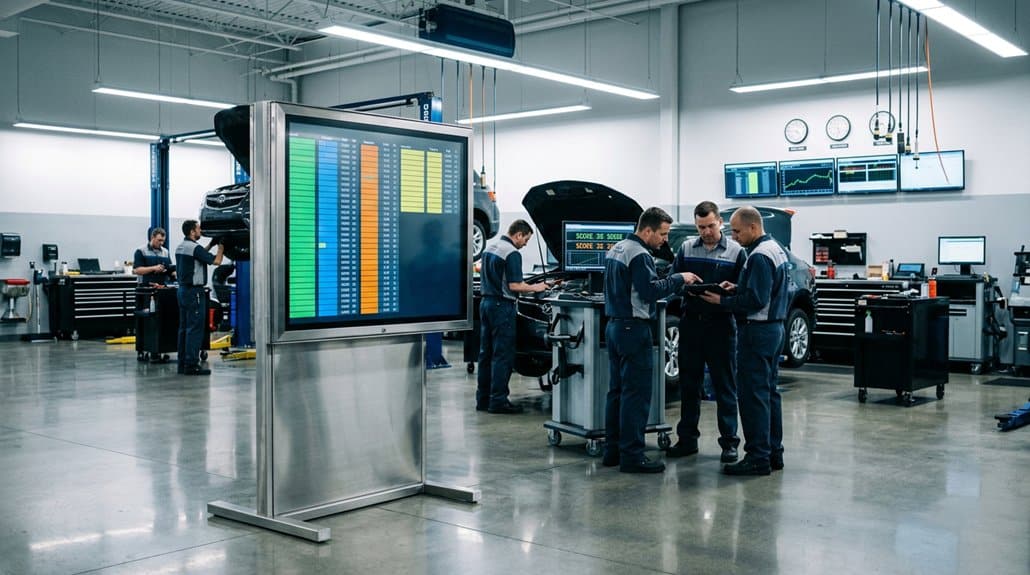
When you set scoreboard rules, be explicit about which metrics—ROs, hours, efficiency, and CSI—count, how they’re weighted, and how often rankings refresh (every 15 minutes) so everyone knows exactly what drives their standing and can act on real‑time feedback. You’ll define weightings tied to business goals (for example: 35% ROs, 25% efficiency, 20% hours, 20% CSI) and publish the formula so ranking transparency is unquestionable. Use a tiered ranking structure to create attainable targets and prevent demotivation while preserving fair competition. Automate 15‑minute refreshes to reflect current performance and enable immediate course corrections. Communicate rules, examples, and update cadence to the team, track outcomes, and iterate weights quarterly based on measured impact to service throughput and customer satisfaction.
Integrate Your DMS and Digital Signage for Live Data
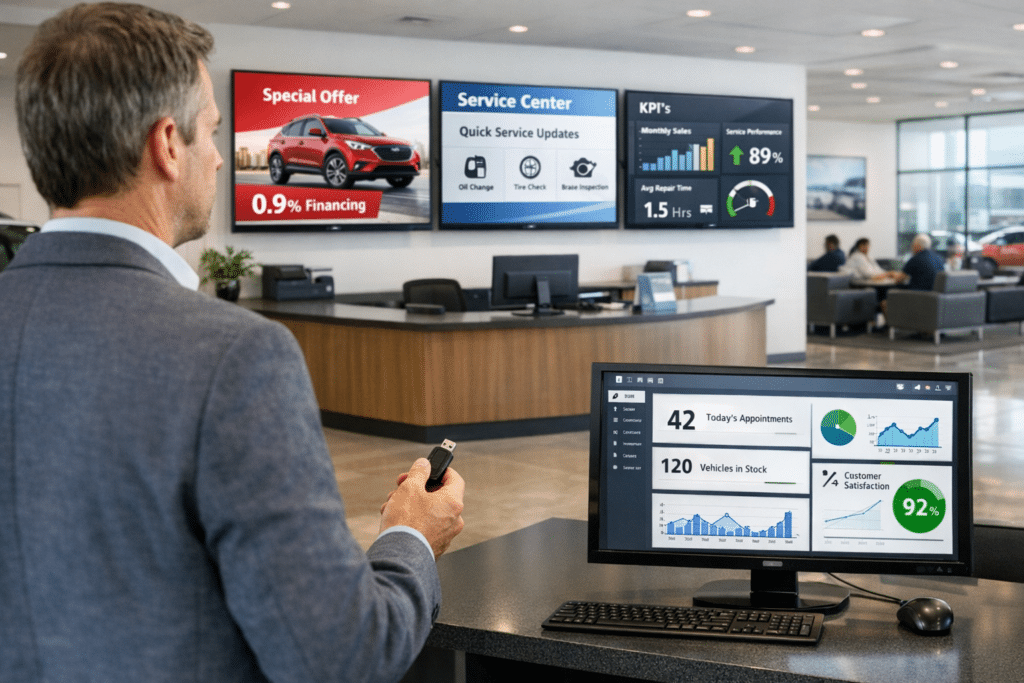
Connect your DMS to digital signage so KPIs sync automatically and you get live displays of sales, efficiency, and technician productivity every 15 minutes. You’ll increase accountability and speed decision-making by showing role-specific metrics on screens via simple HDMI or WiFi setups. Real-time visibility drives measurable engagement and goal attainment across the service department.
DMS-To-Signage Sync
Because real-time visibility drives faster decisions, syncing your DMS with digital signage pushes live KPIs—updated as often as every 15 minutes—directly to the shop floor so staff always see current service appointments, sales, and efficiency figures. DMS integration benefits your operation by eliminating manual reporting, saving roughly 30 minutes daily per location, and reducing error-prone data handling. Real time updates keep advisors and technicians aligned with targets through tailored dashboards that reflect departmental goals and individual performance. That transparency increases accountability: teams respond immediately to schedule shifts, sales opportunities, and efficiency gaps. Implementing a reliable DMS-to-signage sync is a measurable productivity lever—faster adjustments, clearer priorities, and improved engagement translate into quantifiable service throughput gains.
Live KPI Displays
Syncing your DMS to shop-floor screens sets the stage, but live KPI displays take that a step further by pushing updated ROs, hours and efficiency to any modern TV every 15 minutes so your team sees the most current performance data. You’ll get live performance metrics streamed directly from the DMS, reducing manual reporting and reclaiming up to six hours weekly for revenue-generating tasks. Digital signage provides clear data visualization—dashboards, leaderboards, and trend lines—so advisors and technicians instantly understand targets and gaps. That transparency fosters accountability and healthy competition, driving measurable improvements in throughput and efficiency. Deploying these displays is a low-friction, high-impact move that converts raw data into actionable, floor-level results.
How Leaderboards Change Daily Behavior on the Shop Floor
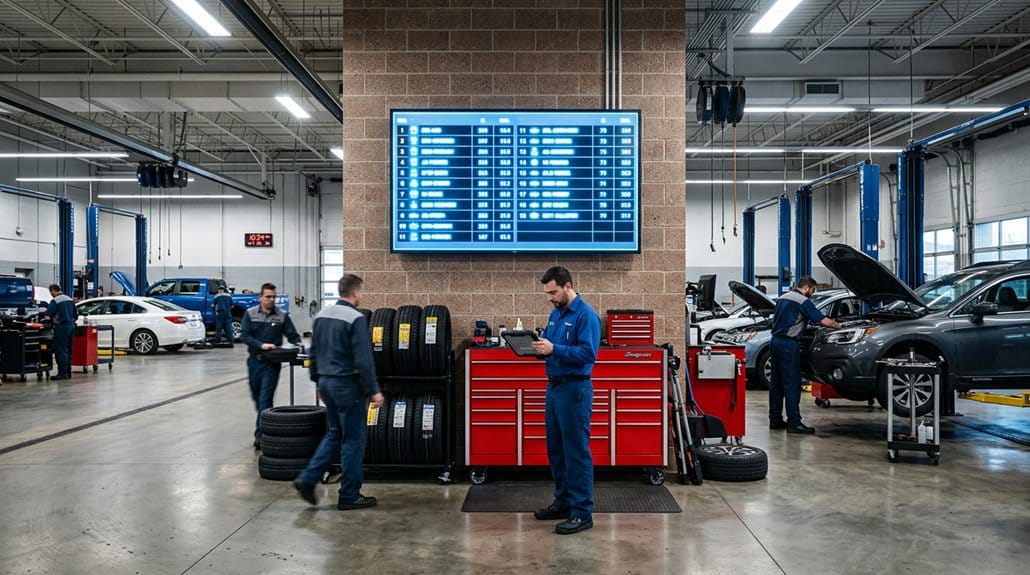
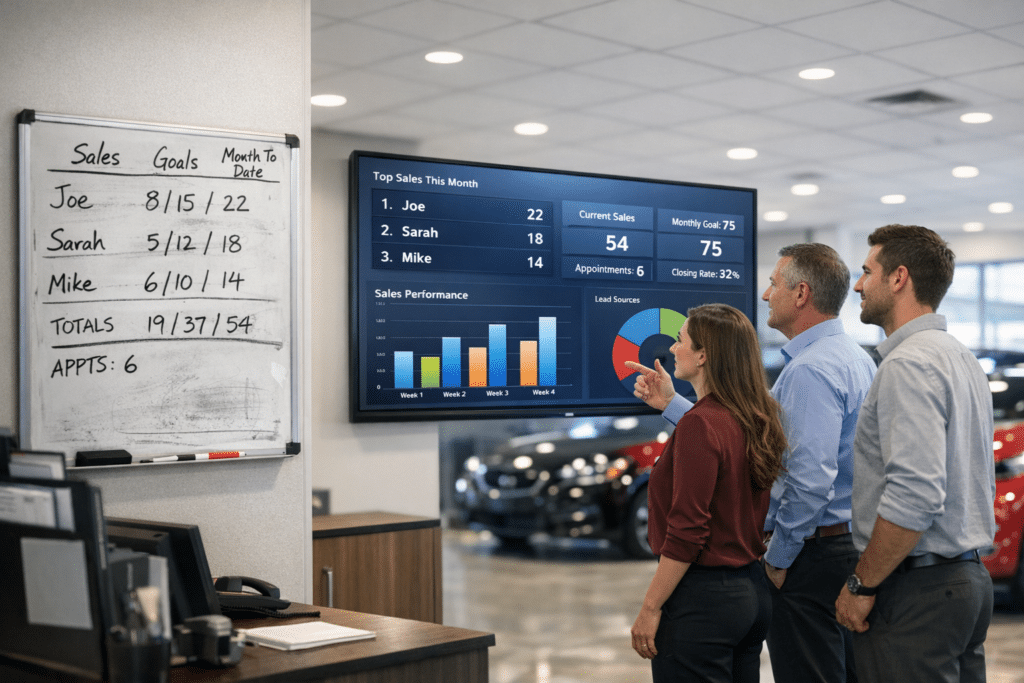
When technicians and advisors can see up-to-the-minute hours, efficiency, and sales on a screen in the bay, they adjust behaviors in real time—shifting priorities, closing upsells, and reallocating time to meet targets. You get continuous feedback on daily performance that drives faster course corrections and measurable gains. With 15-minute updates, transparency makes ownership obvious: techs track their hours, advisors monitor flat-rate efficiency, and both respond to gaps immediately. Showing top performers fuels a competitive spirit that raises averages across the team. The result is higher throughput, increased upsell conversion, and fewer missed opportunities.
Real-time 15-minute updates drive ownership, boost upsells, eliminate bottlenecks, and raise team productivity.
- Monitor hours and efficiency every 15 minutes
- Spot bottlenecks and reassign resources instantly
- Close more upsells with timely prompts
- Reinforce ownership through visible metrics
- Elevate productivity via healthy competition
Set Goals, Incentives & Coaching for Fixed‑Ops Teams
Set specific, measurable targets—like boosting average RO value by $15 or raising flat-rate efficiency by 5%—and tie them to clear incentives so your team knows exactly what success looks like and what they’ll earn. Use real-time leaderboards to enforce goal alignment across advisors and techs, displaying performance metrics such as ROs per day, efficiency, and sales. Publish daily standings to drive healthy competition and focus attention on gaps. Design incentive structures that reward hitting benchmarks tied to those KPIs, and quantify impact (e.g., $15/RO → ~$1,500/mo uplift). Pair incentives with consistent, data-driven coaching: review leaderboard trends, give tailored feedback, set corrective actions, and track improvement. This keeps accountability tight and accelerates measurable revenue and productivity gains.
Track Impact: Which Metrics and How Often
Start by tracking a shortlist of high-impact KPIs—ROs per day, flat-rate hours, efficiency, Effective Labor Rate (ELR), sales per RO, and CSI—and update them frequently so you can act on real-time trends. You’ll use metric selection to focus on measures that drive revenue and customer experience. With leaderboards refreshing every 15 minutes via DMS integration, data accuracy and performance trends are visible instantly for impact assessment and quick course-correction.
- ROs/day: volume and throughput signals
- Flat-rate hours & efficiency: productivity and utilization
- ELR & sales/RO: revenue quality and technician motivation
- CSI: customer-facing outcomes and retention
- Trend windows (15m, daily, weekly): detect shifts and validate feedback loops
Tie results to engagement strategies and clear accountability measures for measurable improvement.
Prevent Gaming and Morale Issues
You’ll minimize gaming by publishing clear, transparent metrics so everyone knows exactly how KPIs are calculated and reported. Use gamification with guardrails—timebound goals, capped rewards, and behavior-based criteria—to drive engagement without incentivizing shortcuts. Back this with regular, fair audits that verify data integrity and reinforce trust across the team.
Clear, Transparent Metrics
When leaderboards display real-time KPIs—updated every 15 minutes—your team can see accurate ROs, efficiency, and sales figures that reduce opportunities for gaming and make accountability measurable; that transparency drives faster, data-driven course corrections, healthier competition, and clearer ownership of individual and storewide goals. You get performance visibility that converts raw data into actionable steps, improving employee engagement by linking daily actions to measurable outcomes. Clear metrics cut ambiguity, so corrective coaching targets specific behaviors instead of perceptions. Trends surface quickly, letting you prioritize interventions that move the needle.
- Track ROs per technician and advisor in real time
- Monitor efficiency rates and cycle times continuously
- Compare sales per shift with historical baselines
- Flag deviations for immediate coaching
- Share storewide dashboards to reinforce ownership
Gamification With Guardrails
Although friendly competition can lift productivity, it needs guardrails so it doesn’t encourage shortcutting or morale problems; you’ll use gamification strategies that tie rewards to verified KPIs like efficiency and sales. Real-time leaderboards updated every 15 minutes give immediate, objective feedback so you can celebrate wins and correct course quickly. By basing the competitive culture on measurable contributions rather than arbitrary counts, you reduce incentives to game the system and keep metrics meaningful. Implemented controls — clear definitions, automated data pulls, and monitored exceptions — preserve accuracy and team trust. The result: higher engagement, transparent accountability, and sustained performance gains without fostering overly aggressive behavior or undermining morale.
Regular, Fair Audits
Because transparent, consistent audits tie reported results to verifiable data, they cut down on gaming and build trust across your service team. You’ll enforce audit frequency that balances timely checks with operational flow, using real-time data to validate advisor and technician metrics. This drives performance transparency, uncovers discrepancies, and turns raw numbers into actionable accountability measures. Fair audits reveal trends for targeted coaching, boosting team engagement and morale by rewarding genuine contributions. Clear, objective criteria keep evaluations defensible and consistent, reducing bias and manipulation.
- Set standardized audit cadence aligned to shift and weekly cycles
- Use real-time dashboards to cross-check reported figures
- Track discrepancy rates and remediation outcomes
- Tie coaching plans to audit-identified skill gaps
- Publish audit summaries for team visibility
Scale Fixed‑Ops Leaderboards Across Stores & Roles
If you scale fixed‑ops leaderboards across stores and roles, you’ll get centralized, real‑time KPI visibility that lets managers spot top and lagging performers instantly, target coaching, and reduce administrative overhead; for multi‑store groups this consistency in ROs, efficiency, and sales metrics not only creates accountability but, by driving small per‑RO gains (for example, $15 more per RO ≈ $1,500/month for a typical dealership), produces measurable revenue upside across the portfolio. You’ll implement a leaderboard strategy tied to clear performance benchmarks for advisors, techs, and shop managers. Centralized dashboards deliver uniform metrics, enable quick cross‑store comparisons, and surface outliers for corrective action. Digital leaderboards cut admin time, accelerate coaching cycles, and convert small KPI improvements into scalable revenue growth across locations.
Frequently Asked Questions
What Do Fixed Ops Do at a Dealership?
They run service, parts, and body operations, optimizing service efficiency, managing repair orders and technicians, tracking KPIs, and coaching teams to improve customer satisfaction, reduce cycle times, boost revenue, and guarantee warranty and compliance accuracy.
What Three Departments Comprise the Fixed Operations of a Dealership?
Like clockwork, you’ll find three: Service Department Roles, Parts Inventory Management, and Body Shop operations. You’ll track metrics, reduce turnaround, boost parts fill rates, and drive repair quality—data-backed, results-focused, concise outcomes.
Who Is Responsible for the Overall Dealership Strategy and Performance?
The General Manager is responsible for overall dealership strategy and performance; you’ll rely on leadership roles to align departments, use performance metrics to drive decisions, and guarantee executive buy-in for measurable, results-oriented operational improvements.
Conclusion
You’ll see real-time fixed‑ops leaderboards turn daily work into measurable momentum: clear KPIs like ROs, ELR and CSI drive focused action, and live DMS-to-signage feeds keep accountability transparent. With fair ranking rules, goals, incentives and regular coaching, you’ll boost efficiency and hours while tracking impact frequently to prove ROI. Guard against gaming and morale dips, scale consistently across stores, and watch performance climb—like a compass guiding every technician toward better, measurable results.