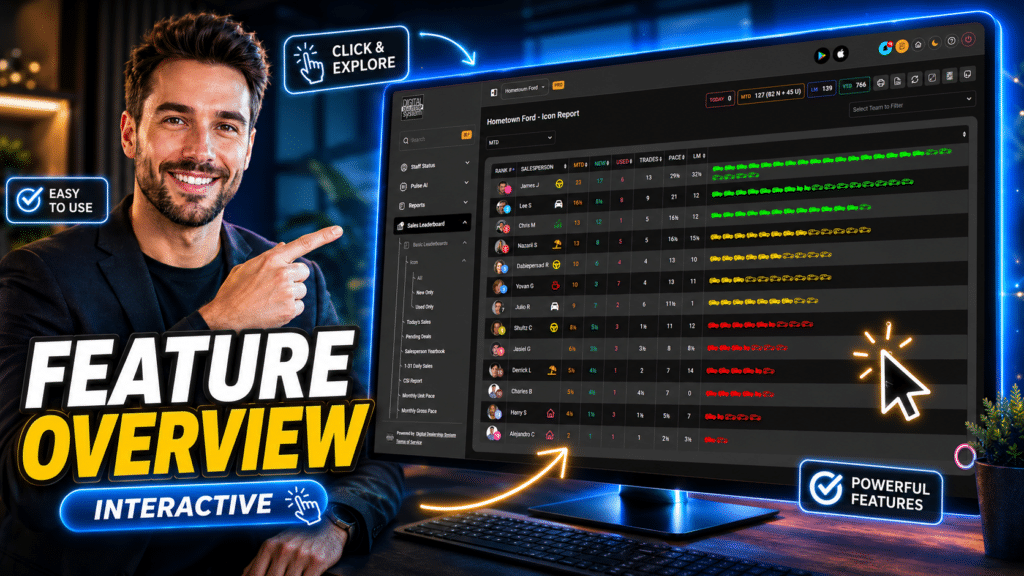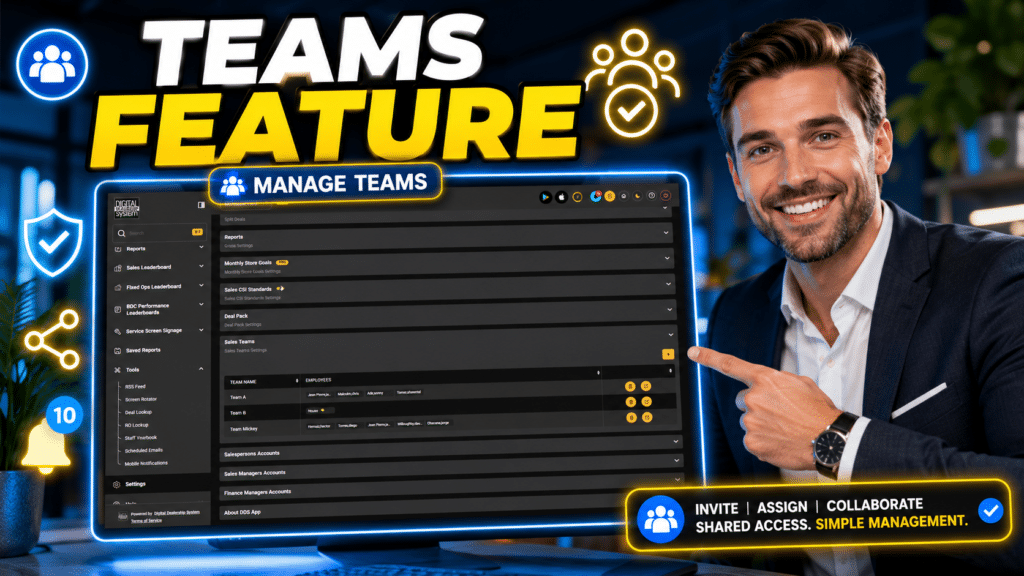

You’ll boost accountability by 20–30% with real‑time sales leaderboards that show objective KPIs—pipeline velocity, lead response time, win rates—so reps self‑monitor instead of being micromanaged. Keep dashboards simple, role‑specific, and CRM‑synced for accuracy, pair weekly check‑ins and deal reviews, and tie recognition to behaviors not just volume. Use anonymized or team views to protect morale and iterate targets from outcome data; continue for practical implementation steps and examples.
Key Takeaways
- Real-time leaderboards surface objective KPIs so reps self-monitor progress without manager intervention.
- Role-specific, simple views focus behaviors, preventing anxiety from irrelevant metrics.
- Integrating with CRM/DMS ensures accurate data, reducing manual oversight and corrective micromanagement.
- Weekly, metrics-centered check-ins convert visibility into coaching-focused conversations, not daily policing.
- Anonymized or team-level displays protect privacy while incentivizing healthy competition and collaboration.
How Real‑Time Dealership Leaderboards Solve Accountability vs. Micromanagement

While managers often worry that close monitoring becomes micromanagement, real-time dealership leaderboards bridge accountability and autonomy by making performance visible and measurable without constant oversight. You get continuous visibility into individual and team metrics, which creates an accountability culture where reps self-monitor and adjust behavior. Displaying sales volume and customer interactions drives leaderboard engagement; that visible benchmark nudges healthy competition and clarifies priorities. Data show implementation can raise sales performance 20–30%, indicating measurable impact rather than perception. Instead of micromanaging tasks, you can target coaching to specific gaps flagged by the board, focusing resources where they’ll move the needle. In short, leaderboards convert raw activity into actionable insight, sustaining accountability while preserving frontline autonomy.
Which KPIs Dealer Leaderboards Should Track (Outcomes, Not Busywork)
Focus your leaderboard on pipeline velocity metrics to measure how quickly prospects move through stages and where time is lost. Pair those velocity measures with clear conversion rate targets to guarantee you’re rewarding outcomes—closed deals and improved efficiency—rather than activity count. Together they pinpoint bottlenecks and quantify whether coaching or process changes are actually improving results.
Pipeline Velocity Metrics
Because speed and conversion beat activity metrics in revealing where deals actually stall, a real-time leaderboard should center on pipeline velocity KPIs like average deal closure time, win rate by stage, and lead response time. You’ll use pipeline efficiency and velocity analysis to expose choke points in deal timelines, quantify sales momentum, and drive conversion optimization. Outcome measurement replaces busywork; performance tracking shows who needs coaching and where processes lag. Accountability frameworks become visible without micromanagement when dashboards display live velocity metrics that reps can self-correct against.
| KPI | Purpose |
|---|---|
| Avg deal closure time | Identifies timeline bottlenecks |
| Lead response time | Measures speed to contact |
| Win rate by stage | Reveals stage-specific conversion gaps |
Conversion Rate Targets
When you tie leaderboard goals to specific conversion rate targets—lead-to-appointment, appointment-to-test-drive, and test-drive-to-sale—you get a direct, measurable line from activity to revenue that highlights who’s closing deals and who needs coaching. You should prioritize conversion rates as the KPI because they quantify how effectively reps turn leads into sales and make outcome-focused comparisons simple. Set clear targets aligned with business goals so each rep owns a measurable piece of performance. Use the leaderboard to surface top converters, capture their conversion strategy, and disseminate best practices. Real-time updates sustain motivation and let managers intervene with coaching rooted in sales psychology rather than micromanagement. This keeps teams focused on impactful behaviors, not busywork.
Design Leaderboard Visibility to Drive Ownership, Not Pressure

If you want leaderboards to drive ownership rather than anxiety, design visibility around clear, actionable metrics and immediate feedback loops that let reps self-correct. You’ll apply visibility strategies and leaderboard aesthetics that prioritize performance clarity over public shaming: simple charts, role-specific views, and discrete alerts. Data shows transparent metrics plus gamification techniques—timed challenges, badges, tiered rewards—raise engagement tactics and fuel a healthy competitive spirit without managerial pressure. Embed feedback mechanisms that surface trends and coaching prompts so reps act on gaps in real time. That combination builds an ownership culture: reps see how individual inputs map to team outcomes, receive instant, contextual signals, and choose corrective actions, reducing escalation and sustaining consistent, measurable improvement.
Integrate Dealership Leaderboards With CRM/DMS for Real‑Time Accuracy
You’ll need a real-time data sync between your leaderboard and the CRM/DMS to guarantee metrics update instantly and reflect true performance. Implement integration safeguards—field mapping validation, change logs, and conflict resolution rules—to prevent mismatches and data drift. Monitor sync latency and error rates as KPIs so you can quantify reliability and fix issues before they distort rankings.
Real-Time Data Sync
Because real-time syncing ties your leaderboard directly to the CRM/DMS, performance metrics update instantly so managers and reps see current rankings, conversion rates, and deal statuses without manual reconciliation. You get immediate data transparency: sales volume, interactions, and closures populate the leaderboard as events occur. That drives accountable, self-directed behavior and reduces micromanagement while letting leaders spot trends and underperformance fast.
| Metric | Source | Update Frequency |
|---|---|---|
| Sales Volume | CRM/DMS | Real-time |
| Customer Interactions | CRM | Real-time |
| Deal Status | DMS | Real-time |
| Conversion Rate | CRM/DMS | Real-time |
| Team Rank | Leaderboard | Real-time |
Real-time sync guarantees accuracy, enables quick corrective action, and keeps incentives aligned with current results.
DMS-CRM Integration Safeguards
While integrating your dealership leaderboard with CRM and DMS systems reveals real-time visibility into sales performance, it also introduces data integrity and access-control risks that must be mitigated. You’ll rely on CRM integration and DMS safeguards to guarantee metrics reflect true activity without exposing PII or allowing unauthorized edits. Assess sync frequency, conflict resolution rules, and data lineage so every leaderboard value maps back to a verified transaction. Enforce role-based access, encryption in transit and at rest, and audit logging to detect anomalies. Automate reconciliation checks that flag mismatches between systems and surface them to managers for quick correction. Prioritize minimal necessary data sharing and regular security reviews to maintain trust in the leaderboard.
- Define sync rules and reconciliation workflows.
- Implement access controls and encryption.
- Schedule audits and anomaly alerts.
Run Regular Leaderboard Rhythms: Weekly Check‑Ins, Deal Reviews, Forecasts

Weekly leaderboard rhythms give your team a predictable, data-driven cadence for accountability: short check‑ins surface real-time metrics, deal reviews convert stalled opportunities into actionable next steps, and forecast conversations tie individual standings to business targets so everyone knows what’s required to hit the number. You’ll use these rituals to sharpen team dynamics and reinforce an accountability culture by delivering concise performance feedback grounded in live data. Weekly check‑ins spotlight trend lines and motivation drivers; deal reviews generate collaborative solutions and practical sales strategies; forecasts guarantee goal alignment and clarify resource allocation. Keep sessions time‑boxed, metrics‑centred, and outcome‑oriented so engagement tactics translate into measurable progress without micromanaging behavior.
Coach From Leaderboard Insights: Questions That Build Judgment, Not Activity
The leaderboard rhythms you just established give you the raw inputs—now use those inputs to coach for judgment, not just activity. You’ll rely on data driven insights to shape coaching techniques that move reps from doing to deciding. Use performance feedback to ask judgment questions that trigger critical thinking about deal strategy and risk, within clear accountability frameworks.
Turn leaderboard data into coaching that trains judgment—ask strategic questions, spotlight risks, and demand accountable decisions.
- Which pattern in the metrics changed the deal trajectory, and what sales strategies will you test next?
- Which obstacle repeats across deals, and how can you reallocate time or resources to remove it?
- What trade-offs are you making between pipeline volume and deal quality, and how will you measure success?
These engagement tactics focus conversations on decisions, not just tasks.
Reward Behaviors With Leaderboard‑Linked Recognition and Incentives
Recognition tied to real‑time leaderboards turns visibility into measurable motivation: when you publicly reward specific behaviors shown on the board—like consistent prospecting, rapid follow‑ups, or high‑quality closes—you reinforce the actions that drive outcomes and can boost engagement and productivity by double‑digit percentages. You should design behavioral incentives that map to desired metrics, creating recognition programs that deliver clear performance recognition and tangible rewards. Use leaderboard data to inform engagement strategies and shape a competition culture that lifts team dynamics rather than tearing them down. Quantify impacts—expect up to 20% higher engagement and a potential 30% boost in productivity—and embed these signals into accountability frameworks. That lets you increase sales motivation while enabling targeted coaching and measured program adjustments.
Avoid Leaderboard Pitfalls: Gamification Failures, Privacy, and Morale Risks
While leaderboards can spark performance gains, they can also backfire if you don’t design and manage them deliberately: unhealthy competition, anxiety among lower performers, privacy concerns, and short‑term gamification can all erode collaboration and long‑term skill development.
- Misaligned leaderboard design and gamification strategies can prioritize short-term wins over skill development; measure behaviors that predict sustainable outcomes, not just transactions.
- Public rankings without contextual performance feedback or stress management supports create anxiety and disengagement; pair updates with coaching, not just visibility.
- Overexposure of individual metrics harms cultural trust and team collaboration; use anonymized or team-level views and selective engagement tactics to protect privacy while preserving accountability.
Be data-driven: track morale indicators alongside sales to validate any leaderboard change.
Measure and Iterate: KPIs to Prove Value and Improve Your Leaderboard Strategy
After addressing privacy, morale, and design pitfalls, you need measurable KPIs to prove that your leaderboard is working and to guide continuous refinement. Define KPI alignment with business goals—track sales volume, average deal size, and customer satisfaction—and surface them via clear data visualization so trends are obvious at a glance. Use performance benchmarking to compare individuals, teams, and time periods, identifying outliers who need coaching or deserve rewards. Tie engagement strategies such as gamification and rewards to measurable lifts in activity and close rates. Feed analytics into sales training by addressing specific weaknesses the leaderboard reveals. Close the loop with continuous improvement: iterate targets, visuals, and incentives based on outcome data, not intuition, to sustain ROI.
Frequently Asked Questions
What Are the 5 C’s of Accountability?
The 5 C’s of accountability are clarity, communication, consistency, collaboration, and celebration. You’ll use communication strategies and performance metrics to define roles, track results, share insights, and recognize progress, driving measurable, accountable behavior.
How Do You Ensure Accountability Without Micromanaging?
You guarantee accountability without micromanaging by setting clear performance metrics, fostering open communication, leveraging team dynamics for peer-driven improvement, and prioritizing trust building through transparent data, targeted coaching, and regular objective feedback loops.
What Are the 4 D’s of Avoiding Accountability?
You’ll see the 4 D’s as: dodge responsibility, deny feedback, delay decisions, disregard goals — deflecting responsibility and fostering excuses become measurable patterns you’ll track, analyze, and correct using clear metrics and documented outcomes.
What Are the 3 C’s of Accountability?
The 3 C’s are Clarity, Consistency, and Coaching. You’ll foster a collaborative culture and transparent communication by setting SMART goals, tracking performance regularly, and delivering targeted coaching—driving measurable ownership and improved sales outcomes without micromanaging.
Conclusion
You’ll turn raw numbers into a compass, not a cudgel: real‑time leaderboards map outcomes (closed deals, gross, conversion) so teams steer by data, not pressure. Design visibility and CRM links to surface facts, run weekly rhythms, and coach with probing questions that sharpen judgment. Tie recognition to measurable behaviors, guard privacy, and iterate with KPIs—then watch accountability rise like compound interest, precise, predictable, and firmly in the hands of your people.