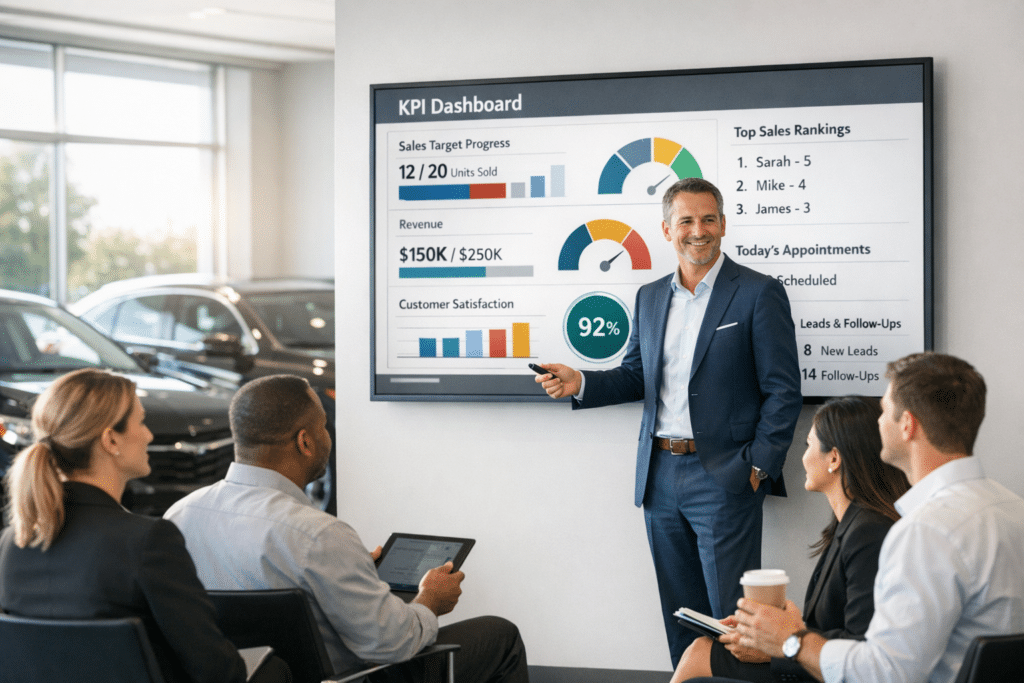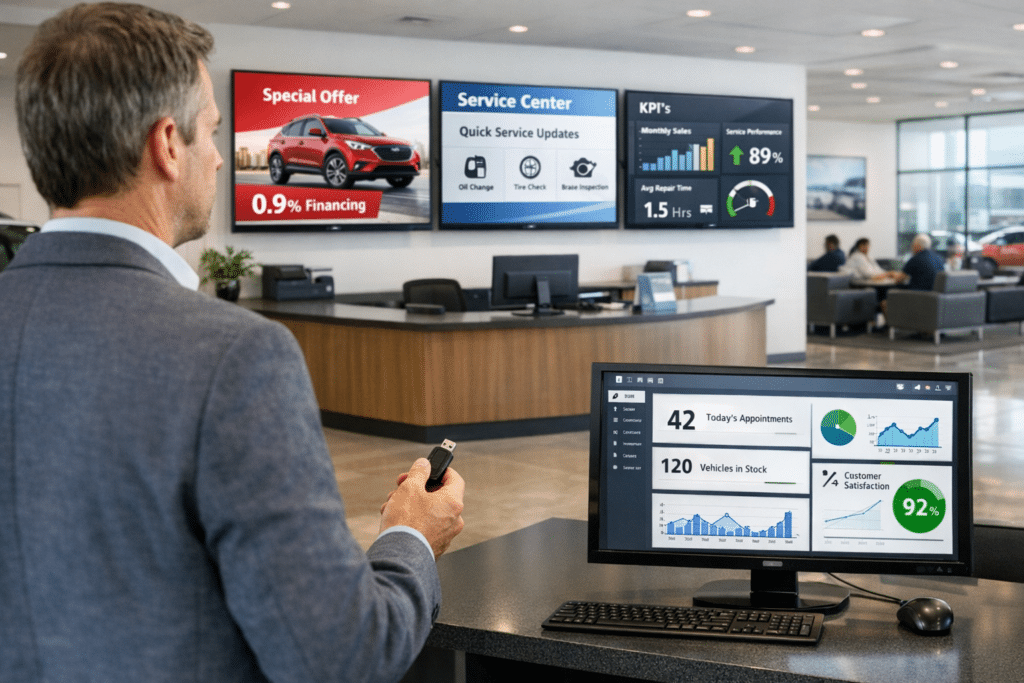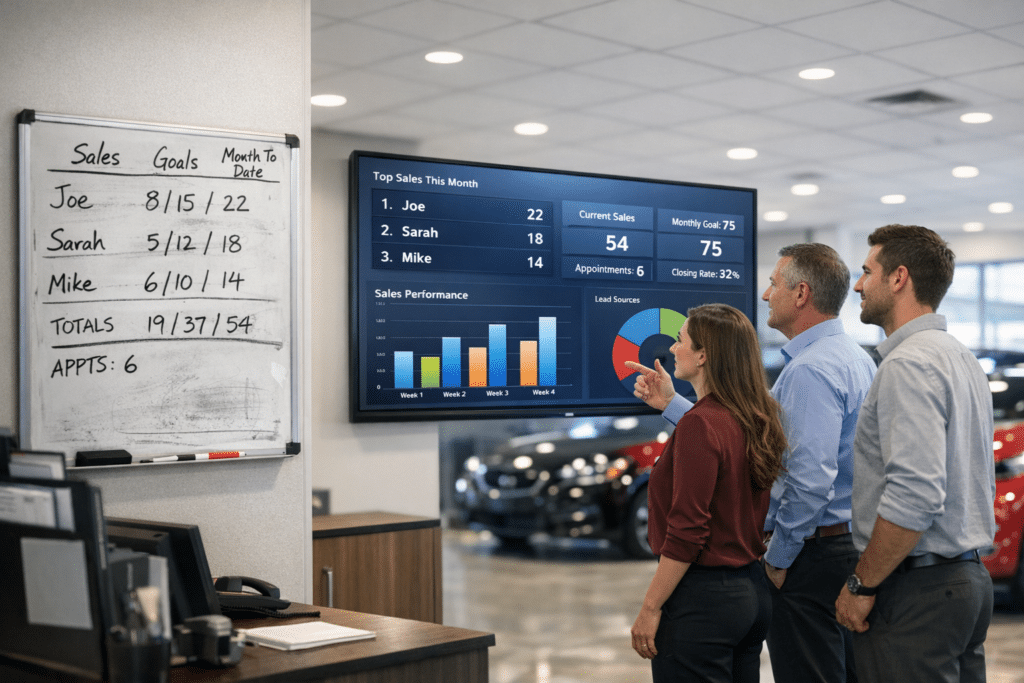

You’ll get live DMS metrics every 15 minutes so you can spot RO, ELR, CSI and no‑show shifts instantly and act before trends worsen. The leaderboard translates raw transactions into role‑specific KPI cards, enforces field mapping and validation, and automates polling to reduce manual reporting. That lets you set time‑bound targets, run contests, and coach to measurable deltas rather than volume. Keep going and you’ll uncover setup, integration and ROI tactics to hit service goals.
Key Takeaways
- Pull live DMS data every 15 minutes to display up-to-the-minute RO counts, ELR, CSI, and AROV for immediate decision-making.
- Translate raw transactions into role-specific KPI cards so advisors and technicians see actionable metrics tied to daily goals.
- Surface deviations from targets and trend deltas to trigger automated coaching, staffing, or pricing interventions in real time.
- Enable live contests and time-bound goals on leaderboards to drive accountability, competition, and sustained performance improvements.
- Maintain deterministic mappings, automated validation, and audit trails to ensure data accuracy and trust for operational decisions.
Why Real‑Time Fixed‑Ops Data Changes Service Performance

When you get fixed‑ops data in real time, you cut decision latency and turn spotting trends from a weekly scramble into an ongoing process; instead of waiting six hours a week to see issues, managers can immediately detect shifts in Customer Pay RO Count, ELR, appointment adherence, and no‑show rates. You’ll use that visibility to apply focused service optimization strategies: prioritize high-impact ROs, adjust technician assignments, and tweak labor mix to protect ELR. Real-time appointment adherence and no‑show monitoring lets you refine scheduling rules and deploy targeted reminders. Those actions form repeatable performance improvement tactics—measure, intervene, verify—that reduce churn and raise throughput. By operationalizing live KPIs you convert reactive firefighting into disciplined, data-driven processes that sustain measurable gains.
How an Automated Fixed‑Ops Leaderboard Works in 3 Steps
Think of the leaderboard as a live operating dashboard: it pulls DMS data every 15 minutes, translates raw transactions into KPI cards (RO counts, ELR, efficiency, sales), and presents role-specific views so advisors and technicians instantly see where they stand. You’ll follow three streamlined steps to convert data into daily action.
- Ingest and normalize: automated DMS sync reduces manual reporting time and centralizes metrics for consistent performance tracking.
- Visualize and allocate: KPI cards and role views spotlight current results, enabling quick decisions and resource shifts toward service quality.
- Act and iterate: teams respond to real-time insights, fostering competition enhancement and accountability while management refines targets based on trends.
This process drives faster corrective action and measurable productivity gains.
Which Fixed‑Ops KPIs Your Leaderboard Should Show
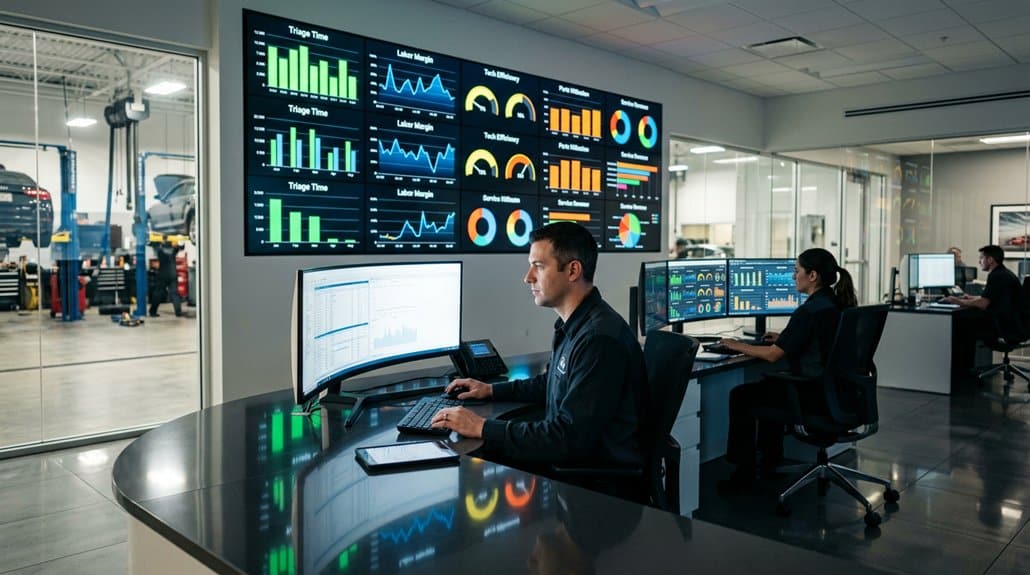
You’ll want your leaderboard to surface key repair order metrics like Customer Pay RO Count so you can track volume and throughput at a glance. Pair those with ticket value drivers such as AROV and OP‑Code Saturation Rate to spot upsell gaps and prioritize profitable jobs. Finally, include advisor performance scores tied to CSI and ELR to drive targeted coaching and measurable productivity gains.
Key Repair Order Metrics
Start with the handful of repair-order KPIs that drive day-to-day decisions: Customer Pay RO Count, Average Repair Order Value (AROV), Customer Satisfaction Index (CSI), Effective Labor Rate (ELR), and OP‑Code Saturation Rate. You’ll use these Service Metrics to monitor Customer Pay volume and Revenue Potential, flagging shifts in Service Effectiveness and Upsell Opportunities. Track trends to reveal Technician Performance, Labor Management gaps, and Quality Improvement needs so you can prioritize Performance Coaching and Training Needs.
- Identify underperforming advisors via CSI and Customer Pay RO Count.
- Target Upsell Opportunities through AROV and OP‑Code Saturation insights.
- Optimize ELR to improve Technician Performance and labor profitability.
Automated leaderboards make these processes actionable in real time.
Ticket Value Drivers
Having set the Service Metrics that flag volume, revenue potential, and technician performance, focus next on the ticket-level drivers that your leaderboard must surface to turn insights into actions. You’ll track Customer Pay RO Count and AROV to drive ticket pricing and upsell strategies, tie ELR and OP-Code Saturation to labor optimization and service efficiencies, and monitor CSI for customer retention. That mix informs technician training and performance incentives to improve revenue enhancement.
| KPI | Purpose |
|---|---|
| Customer Pay RO Count | Volume and demand signals |
| AROV | Ticket pricing and upsell pull-through |
| ELR | Labor optimization and clock management |
| OP-Code Saturation | Efficiency, targeted coaching |
| CSI | Retention, service quality feedback |
Advisor Performance Scores
Clarity in advisor performance scores gives you a concise roadmap for action: Automated leaderboards surface Customer Pay RO Count, AROV, CSI, ELR and OP-Code Saturation Rate so you can tie daily behaviors to revenue and retention. You’ll use these KPIs to drive advisor engagement and deliver timely performance feedback that’s specific and measurable. Focus dashboards on actionable deltas, not raw volume, so coaching targets improve productivity and profitability.
- Prioritize RO Count and AROV to boost ticket revenue and identify upsell coaching.
- Monitor CSI for service quality goals and loyalty-driven incentives.
- Track ELR and OP-Code Saturation for job selection efficiency and labor profitability.
This process-driven approach guarantees continuous improvement via targeted coaching and measurable outcomes.
How Leaderboards Pull Live Data From Your DMS (Data Mapping & Compatibility)
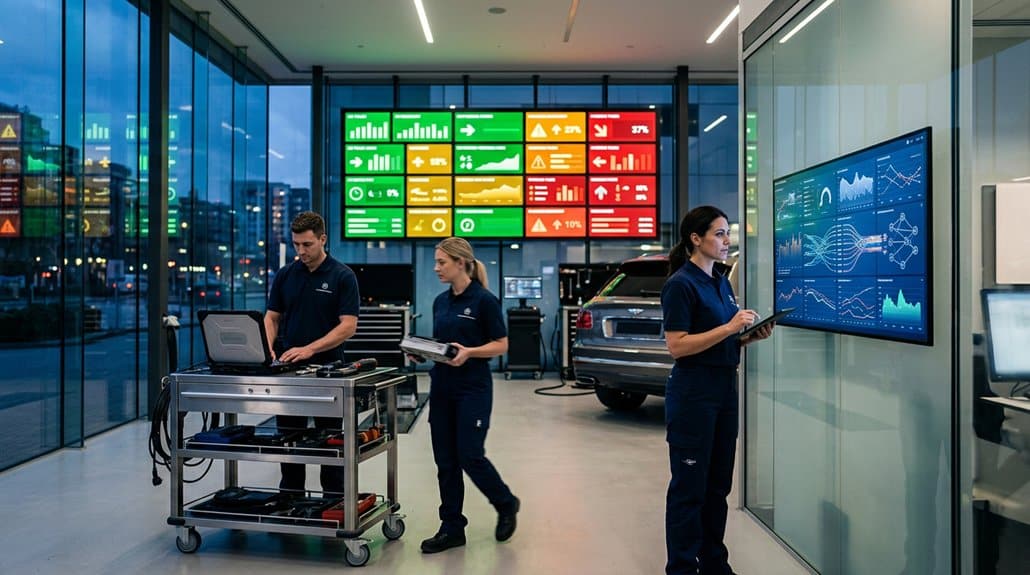
To connect your leaderboard to the DMS you’ll evaluate integration methods (API, middleware, or ETL) and pick the approach that minimizes latency and maintenance. Next, you’ll enforce field mapping standards so ROs, ELR, and CSI align exactly between systems and avoid reconciliation errors. Finally, you’ll implement real-time syncing protocols—typically 15‑minute pushes or webhooks—to guarantee dashboards reflect current performance for rapid operational decisions.
DMS Integration Methods
How exactly do leaderboards pull live performance data from your DMS, and what makes that flow reliable? You’ll use standardized DMS integration methods that address DMS compatibility challenges while applying robust Data mapping techniques to align ROs, hours, and sales to KPIs. Integrations poll your DMS every 15 minutes, syncing continuously to minimize manual reporting and keep managers focused on improvement. Setup is straightforward: connect the media player via HDMI and WiFi, authorize the integration, and confirm mapping rules. The result is consistent, near-real-time visibility across teams.
- Automated polling intervals (15 minutes)
- Mapped KPI alignment (ROs, hours, sales)
- Compatibility with major DMS platforms
This process-driven approach guarantees reliable, actionable insights.
Field Mapping Standards
Moving from DMS integration mechanics to the specifics of field mapping, you’ll see how standardized field definitions and mapping rules turn raw DMS records into the KPIs that drive leaderboards. You’ll define each source field (RO number, labor hours, CSI scores) and map it to a canonical field used by the leaderboard engine. That discipline enforces consistent field mapping across dealer locations and DMS platforms, reducing interpretation gaps. You’ll validate mappings with automated checks and sample reconciliations every sync cycle to preserve data accuracy. With clean mappings, leaderboards ingest RO counts, efficiency rates, and advisor performance without manual edits, enabling 15-minute refreshes to reflect reality. The result: actionable, comparable metrics that support fast, measurable service improvements.
Real-Time Syncing Protocols
Because leaderboards refresh every 15 minutes, your fixed ops data pipeline must handle rapid extracts, deterministic mappings, and conflict-free writes so KPIs reflect the shop floor in near real time. You’ll rely on robust connectors to pull repair orders, labor rates, and satisfaction scores from the DMS, normalizing fields to a universal schema that guarantees data accuracy. Real time notifications alert teams to anomalies and updates, removing manual reporting and accelerating corrective action. Integration testing validates compatibility across dealer locations and DMS vendors, ensuring deterministic merges and rollback safety. Focus on these operational controls:
- Extract cadence and backoff strategy
- Deterministic field mapping and validation rules
- Conflict resolution and audit trails
This process-driven approach delivers accountability and measurable uptime for leaderboards.
Set Measurable Goals for Advisors and Technicians
Start by translating real-time leaderboard metrics into clear, time-bound targets for advisors and technicians so everyone knows exactly what success looks like and how it’s measured. Use goal setting strategies that map KPIs—Customer Pay RO Count, AROV, ELR, OP-Code Saturation—into daily and weekly targets, then publish them on the dashboard. With 15-minute updates, you can implement tight performance tracking loops: set a baseline, monitor deviations, and trigger corrective coaching or task adjustments immediately. Define specific thresholds (e.g., AROV +5% week-over-week, ELR target per tech) and assign ownership. Track progress quantitatively, review trends, and iterate targets based on rolling data. This process-oriented approach drives measurable improvements and creates transparent accountability across service teams.
Use Leaderboards to Run Contests, Accountability, and Coaching
Use live contest leaderboards to set short-term targets and measure who’s driving the highest Customer Pay RO Count and AROV so you can reward top performers quickly. Keep real-time accountability metrics visible so advisors own their rank and you can spot performance gaps as they occur. Then run data-driven coaching sessions using ELR and OP-Code Saturation trends to create focused action plans that lift revenue and satisfaction.
Live Contest Leaderboards
Live contest leaderboards turn KPIs into actionable, real-time performance drivers by displaying metrics like Customer Pay RO Count and Average Repair Order Value and updating every 15 minutes so you and your team can see progress, gaps, and momentum as they happen. You’ll harness competitive spirit and boost team engagement by running time-bound contests that make targets visible and measurable. Digital signage and mobile access keep everyone aligned, while automated refreshes remove manual reporting lag. Use leaderboard insights to target coaching, elevate underperformers, and recognize top producers quickly. Focus on process: set clear rules, define metrics, and monitor trends. Key operational benefits:
- Increased motivation through visible rankings
- Faster corrective coaching
- Clearer performance benchmarking across roles
Real-Time Accountability Metrics
Because real-time leaderboards refresh every 15 minutes, they give you immediate visibility into KPIs like Customer Pay RO Count, Effective Labor Rate, Appointment Adherence, and OP-Code Saturation so you can run contests, enforce accountability, and coach with precision. You’ll use automated updates to drive real time engagement: short contests tied to appointment adherence and no-show reduction create measurable behavior shifts. Performance visibility at the individual and team levels makes expectations explicit, so managers can enforce standards and recognize top performers. Process-driven workflows link leaderboard alerts to corrective actions—coaching touchpoints, retraining, or incentive payouts—ensuring continuous improvement. By measuring OP-Code Saturation and conversion rates in the same dashboard, you can prioritize interventions that boost profitability while maintaining transparent, accountable operations.
Data-Driven Coaching Sessions
Real-time leaderboards don’t just show who’s ahead—they give you the evidence you need to run focused coaching that produces measurable results. You’ll use live performance metrics like Customer Pay RO Count, AROV, ELR, and OP-Code Saturation to diagnose gaps, set targets, and tailor coaching strategies for advisors and techs. Contests driven by these KPIs create structured incentives, while transparent rankings enforce accountability.
- Identify: spot variance from targets using real-time KPIs.
- Coach: run short, actionable sessions tied to specific performance metrics.
- Reward: launch contests that reinforce desired behaviors.
This process-driven approach turns leaderboard insights into repeatable coaching workflows, so you can close gaps fast and track improvement quantitatively.
Customize KPI Cards and Views for Each Role
When you tailor KPI cards and views by role, Service Advisors and Technicians get focused metrics—like Repair Order counts for advisors and Effective Labor Rates for techs—that drive daily actions and measurable outcomes. You’ll use KPI customization and role specific metrics to align dashboards with individual goals, stacking multiple KPI reports into single displays for compact insight. The backend lets you configure views per employee, promoting accountability through transparent, measurable targets updated every 15 minutes. That cadence lets you course-correct tactics in real time, whether reallocating workload or adjusting targets. Unlimited customized reports mean you can scale metric coverage without clutter, supporting structured coaching, streamlined performance evaluations, and predictable improvements across service department workflows.
Integrate Digital Signage, Mobile, and Desktop for Fixed‑Ops Teams
1 integrated display strategy connects digital signage, mobile, and desktop so your fixed‑ops teams see the same KPI story at every touchpoint—updating every 15 minutes from DMS‑connected reports to surface Customer Pay RO Count, AROV, and other priority metrics. You’ll reduce lag, streamline reporting, and enable real‑time decision loops that improve throughput and revenue per ticket. This is digital transformation applied to daily operations, turning data into actionable prompts for service advisors and techs.
- Standardize KPIs across screens to eliminate confusion.
- Prioritize alerts for threshold breaches to prompt immediate action.
- Track usage and response rates to quantify team collaboration gains.
The result is measurable operational efficiency, lower admin overhead, and sustained performance improvement.
Quick Setup Checklist: Implementation, Training, and Launch
Getting your leaderboard live is straightforward and focused: plug the customized media player into any modern TV via HDMI, connect to your WiFi, and link the system to your DMS so data flows every 15 minutes. Start with a concise setup timeline: unbox, mount, connect, authenticate, and verify mobile/desktop access—each step should have a clear owner and target time. Use provided training resources to run role-based sessions that teach daily checks, KPI interpretation, and escalation paths. Launch only after a short pilot with real data confirms update cadence and visibility on all platforms. Post-launch, schedule recurring coaching and a single-point support contact to keep adoption high and performance improvements measurable.
Measure ROI and Troubleshoot Data Gaps for Accuracy
Accuracy is everything: to measure ROI from your fixed ops leaderboard you’ll need a repeatable process that ties real-time KPIs—like Customer Pay RO Count, AROV, ELR, and OP-Code Saturation—directly to revenue and efficiency outcomes. You’ll run ROI Analysis by mapping those metrics to revenue streams, time-to-complete, and labor utilization, using data refreshed every 15 minutes to spot variance. When numbers diverge, troubleshoot Data Accuracy by isolating source fields, validation rules, and sync latency.
- Identify missing or inconsistent fields and set automated alerts.
- Reconcile KPI-to-revenue calculations weekly and document adjustments.
- Generate customizable reports to validate assumptions and measure lift.
This process-driven approach gives you repeatable validation, faster remediation, and clearer ROI conclusions.
Frequently Asked Questions
What Do Fixed Ops Do at a Dealership?
Fixed ops run your dealership’s service, parts, and repairs, optimizing service efficiency and technician productivity. You’ll streamline workflows, track KPIs, boost customer satisfaction, and drive recurring revenue through process-driven scheduling, parts management, and quality control.
What Three Departments Comprise the Fixed Operations of a Dealership?
They’re the Service, Parts, and Body Shop departments. You’ll measure Service Department Efficiency and Parts Inventory Management to drive process improvements, track KPIs, optimize workflows, and produce measurable, actionable results across fixed ops.
Conclusion
You’ll boost service performance by using real‑time leaderboards to turn data into daily actions: teams see targets, track throughput, and fix issues fast. Consider this: dealerships using live fixed‑ops dashboards report up to a 20% faster repair order cycle time, meaning more capacity and happier customers. Focus on measurable KPIs, mapped DMS feeds, role‑specific views, and a rapid rollout with training. Iterate monthly—measure ROI, close data gaps, and keep improving.