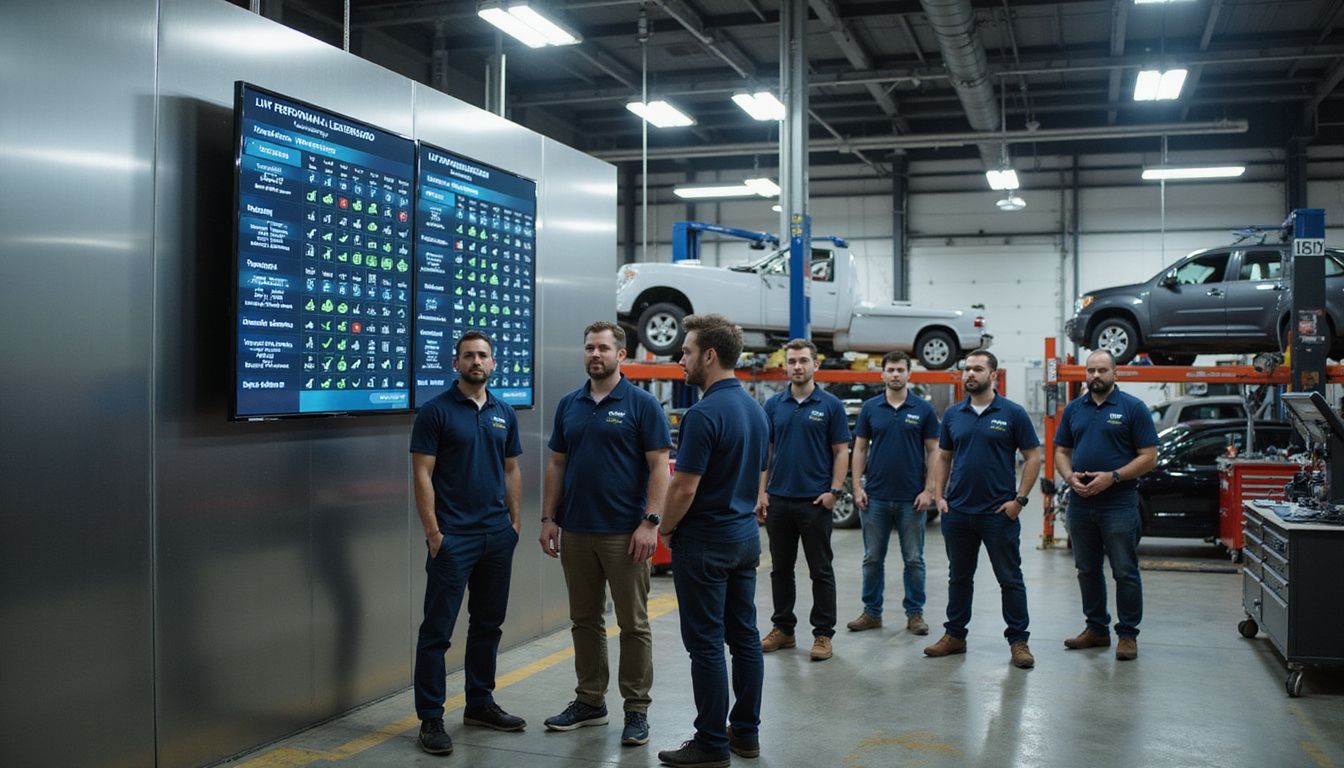
Ever walk through your service department and wonder why some advisors close way more repair orders than others, even though everyone seems to work just as hard?
That gap isn’t bad luck. It’s a lack of visibility.
Here’s something I’ve noticed watching dealerships turn this around: once your team can actually see their own numbers, they start beating them. That’s exactly what real-time fixed ops leaderboards do. They refresh every 15 minutes straight from your dealership management system, showing repair orders, technician efficiency, effective labor rate, and customer satisfaction scores for your whole shop.
I’m going to walk you through exactly which metrics matter, how to set this up, and how to keep the whole thing fair. Grab a coffee, and let’s get your service department running like the profit engine it’s supposed to be.
Key Takeaways
- Real-time fixed ops leaderboards refresh every 15 minutes through DMS integration, showing repair orders, technician efficiency, effective labor rate, and customer satisfaction instantly.
- Tracking repair orders drives revenue. Dealerships using Service AI saw a 27% jump in repair orders, and each $15 increase in average repair order value adds $1,500 a month.
- Efficiency and labor hours make up 45% of leaderboard weighting (25% efficiency, 20% hours), making them critical to service department profit.
- Customer satisfaction index carries 20% of the leaderboard weight. 74% of car buyers serviced by their dealer return for their next purchase, and Service AI brought back 33% of inactive customers.
- Regular audits and transparent metrics stop gaming, keep competition fair, and build team trust in your leaderboard system.
What Are Real-Time Fixed Ops Leaderboards?

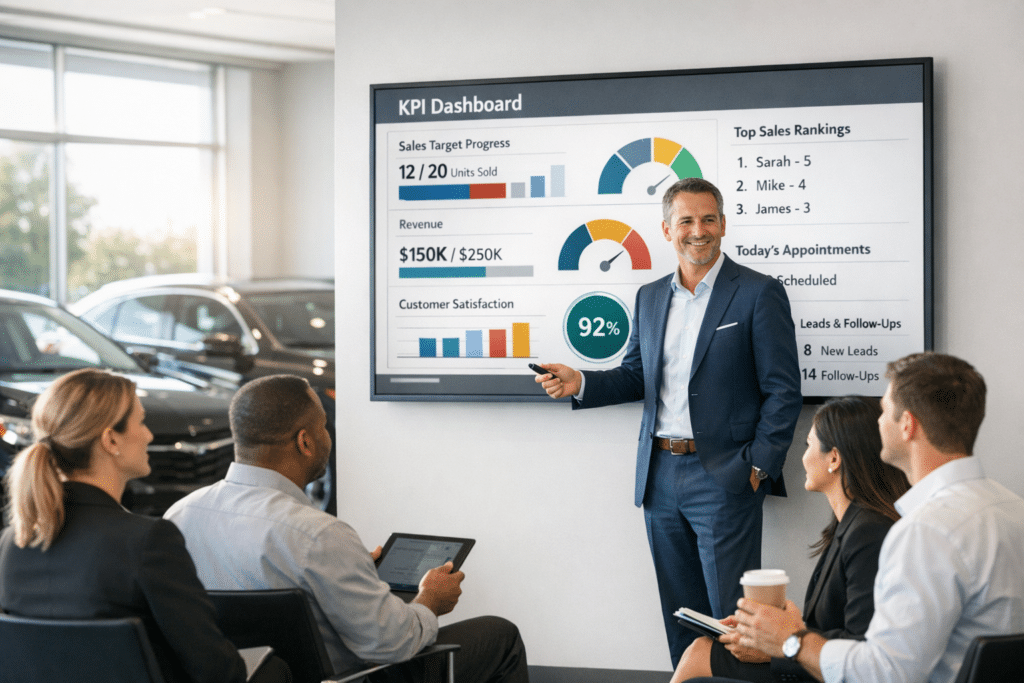
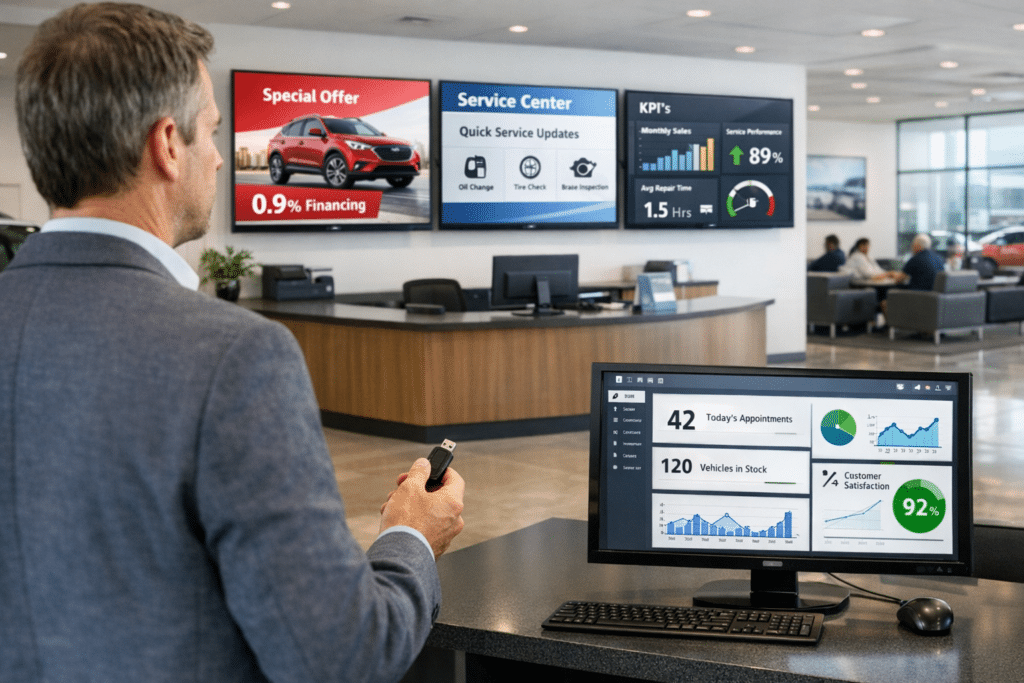
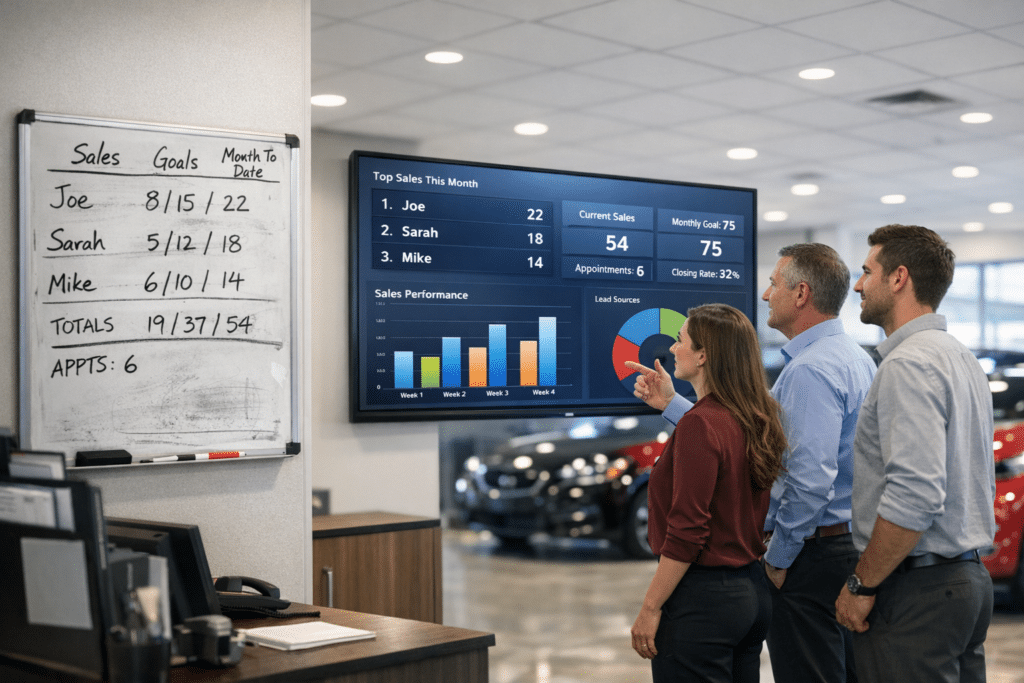
Real-time fixed ops leaderboards are live dashboards that show your service department’s current performance to advisors and technicians. These digital signage displays refresh every 15 minutes through a direct link to your Dealer Management System, so every number stays accurate and current.
Your team sees these numbers update instantly:
- Repair orders completed
- Technician productivity
- Effective labor rate
- Customer satisfaction index
- Hours worked
This kind of visibility changes how your service engine runs. It moves your team away from outdated spreadsheets and manual reports, the kind that eat up roughly 30 minutes a day per location.
Digital signage tied to your DMS moves data automatically across the shop. That cuts down on manual entry errors and helps you catch trends faster. Your advisors and technicians don’t wait for a weekly meeting to know where they stand. They see it the moment it changes.
The real power shows up in mid-shift coaching. An advisor can adjust course the moment customer pay RO count dips. A technician can tighten up their workflow the second efficiency data slips, cutting repair cycle time before it becomes a habit.
This immediate feedback builds accountability without feeling like punishment. Your team understands exactly which actions move the needle on service revenue and customer retention, and they start chasing benchmarks that match NADA guidelines and industry standards.
Here’s why this matters so much: fixed operations generate roughly 50% of a dealership’s total gross profit, even though they make up just 10% to 15% of total sales, according to a 2026 report from Impel AI analyzing NADA performance data. That’s the real reason a live leaderboard in your service department pays for itself fast. Now let’s break down exactly which metrics you should track to boost service and parts revenue.
Which Key Metrics Should You Track to Boost Service and Parts Revenue?

Your service department makes money through a handful of specific numbers you can measure and improve. Track repair orders, labor hours, customer satisfaction scores, and effective labor rates, and you’ll see exactly where your revenue really comes from.
How Do Repair Orders (ROs) Impact Revenue?
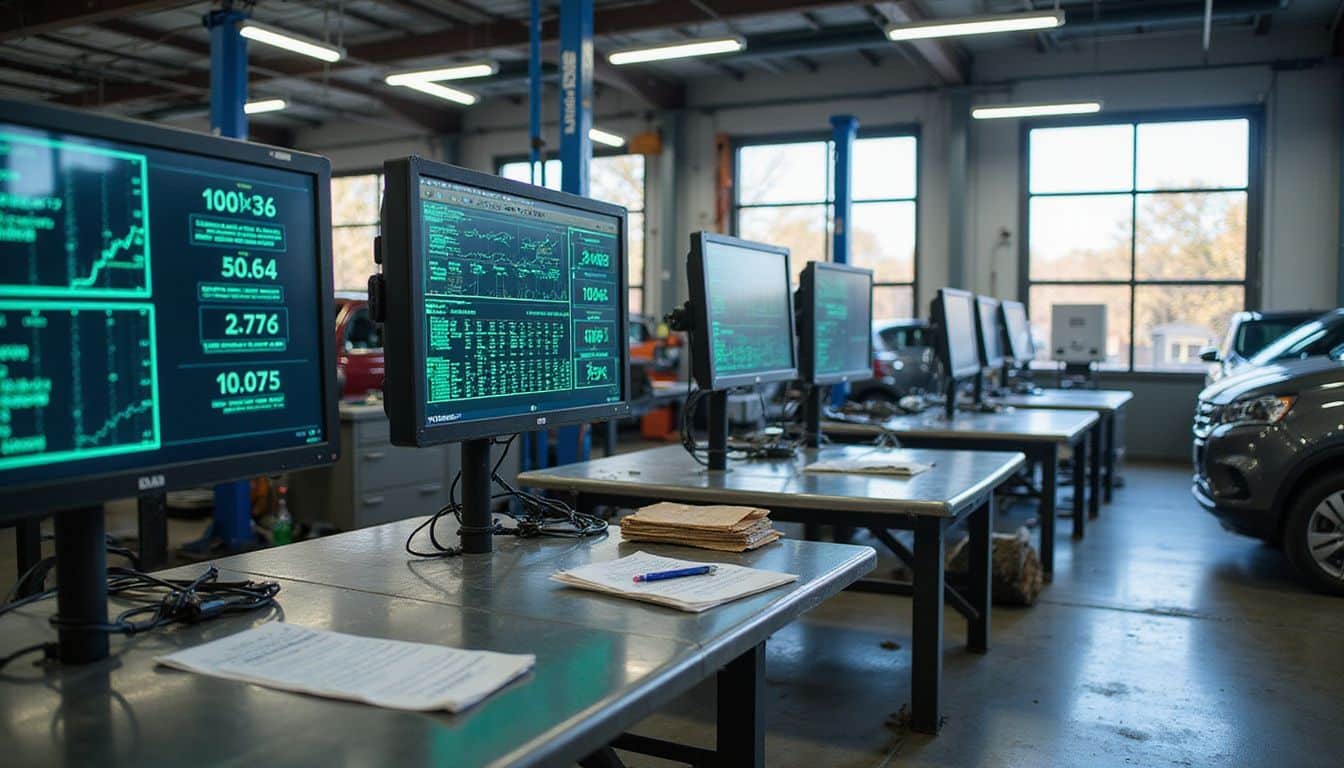
Repair orders are the backbone of your service department’s revenue. Each one is a customer interaction that pays your bills, so tracking ROs per technician and advisor matters more than almost anything else on your board.
The scale here is huge. According to NADA mid-year data published in recent industry benchmarks, U.S. franchised dealers write over 137 million repair orders every six months, generating more than $81 billion in service and parts revenue. When volume is that big, even a small lift in your completion rate turns into real money fast.
Dealerships using Impel’s Service AI saw a 27% increase in repair orders from existing customers, an average of 95 more completed ROs. Each $15 increase in average repair order value can add up to $1,500 a month for a typical dealership. Real-time leaderboards refresh every 15 minutes, so you catch trends before they slip away.
One mid-size dealer put this to the test. They connected their DMS to wall-mounted digital signage and tracked RO completion over 60 days.
| Metric | Before Leaderboard | After 60 Days |
|---|---|---|
| Weekly repair orders | 360 | 455 (up 26.4%) |
| Average repair value | $425 | $440 |
| Added monthly revenue | – | $1,680 |
The service manager noticed something simple. Once advisors saw live RO counts every 15 minutes, they changed how they prioritized customer callbacks and booking. Within two months, the team hit a steady lift in both completed ROs and average repair value.
Repair orders are not just paperwork. They are the direct path to growing your service revenue and building customer loyalty.
Digital signage tied to your DMS shows ROs per day instantly, so your team sees performance the moment it happens. Technicians and advisors work harder when they know their numbers show up on the board.
Track average repair order value next to completion rates, and you get a full picture of efficiency and profit at the same time. Leaderboards build accountability without blame, turning individual effort into a team push toward higher revenue.
Why Are Efficiency and Labor Hours Important?
Efficiency and labor hours are the backbone of your service department’s profit. These two metrics make up 45% of your leaderboard weighting, 25% for efficiency and 20% for hours, and that split tells you how much they matter to your bottom line.
Here’s why this matters more than ever. According to updated 2026 NADA and TechForce Foundation workforce data, the auto repair industry faces an annual shortfall of nearly 37,000 qualified technicians. Roughly 39,000 new techs graduate each year, but the industry needs about 76,000 just to keep up with retirements and demand. You can’t hire your way out of that gap. Getting more value from the technicians already on your floor becomes the only real path to growth.
Your technicians’ productivity gets measured through flat-rate hours and efficiency rates. Tracking these numbers gives you real visibility into who’s producing results and who needs coaching.
Raising flat-rate efficiency by just 5% creates measurable gains in revenue, faster diagnostic intake, and smarter bay loading across your shop.
Your digital signage shows these metrics every 15 minutes, so your team spots performance gaps instantly and adjusts on the fly. Labor hours directly shape your effective labor rate, which decides how much profit you actually keep on each job.
Comparing sales per shift against your historical baseline helps you spot whether technicians work at peak capacity or leave money on the table. Watching efficiency rates and cycle times closely also reveals bottlenecks, whether that’s scheduling conflicts, parts delays, or skill gaps.
Real-time coaching works because leaderboards show who excels at throughput and who’s struggling, without pointing fingers. That turns labor hours from a cost line into a strategic tool that pushes your service and parts revenue higher.
What Does the Customer Satisfaction Index (CSI) Measure?

Your Customer Satisfaction Index tracks how happy your customers feel about their service visit. It’s a customer-facing number, but it hits your retention and profit directly.
CSI carries a 20% weight in your leaderboard scoring, so it plays a big role in your team’s overall ranking. Your team measures it through client feedback and repeat business rates.
This matters because 74% of car buyers serviced by their dealer return for their next vehicle purchase, according to Cox Automotive data. Dealerships using Service AI technology saw 33% of previously inactive customers come back for service, which shows just how much satisfaction drives loyalty.
According to the J.D. Power 2026 U.S. Customer Service Index (CSI) Study, when dealer service satisfaction scores hit 950 or higher on a 1,000-point scale, 86% of mass-market customers say they will definitely return to that dealer for paid service.
That’s your target number. Hit 950, and you lock in future RO volume and parts revenue almost automatically.
Your digital signage displays CSI scores and updates them every 15 minutes, keeping this number visible across your service department. Declined services need immediate follow-up too, since customers who turn down recommended work often signal dissatisfaction before they say a word.
Pre-CSI campaigns run automatically to head off problems before they grow. When your advisors and technicians watch these scores climb in real time, they understand exactly how their actions shape customer retention and recovery.
How Can Effective Labor Rate (ELR) Improve Profitability?
While customer satisfaction keeps clients coming back, the real money flows through your service department’s labor efficiency. Effective Labor Rate, or ELR, measures the dollar value you generate per labor hour billed, and it hits your bottom line directly. According to 2026 dealership profitability research analyzing McKinsey benchmarks, improving your ELR by just $10 an hour can add $50,000 or more to a typical dealership’s annual gross profit, without selling a single extra hour of labor.
Think of ELR as the heartbeat of your service department’s profit. A technician billing high-value work generates more revenue than one running routine maintenance. AI-driven tools can help you optimize ELR, turning every labor hour into meaningful income.
Your DMS integration updates ELR data every 15 minutes, giving you live visibility into what’s happening on the shop floor right now. This kind of real-time feedback lets you catch trends before they turn into bigger problems.
- Compare ELR trends daily and weekly to catch profit dips fast
- Display ELR leaderboards on digital signage so staff see clear, visual progress
- Tie ELR improvements to team incentive structures
- Centralize leaderboards across stores so no location falls behind
A technician earning $45 per labor hour billed generates far more profit than one earning $25 an hour. That gap compounds fast across your whole service operation. ELR improvements reshape how your team tackles each repair order, pushing them toward higher-value work and smarter scheduling.
Leveraging Live Data Integration
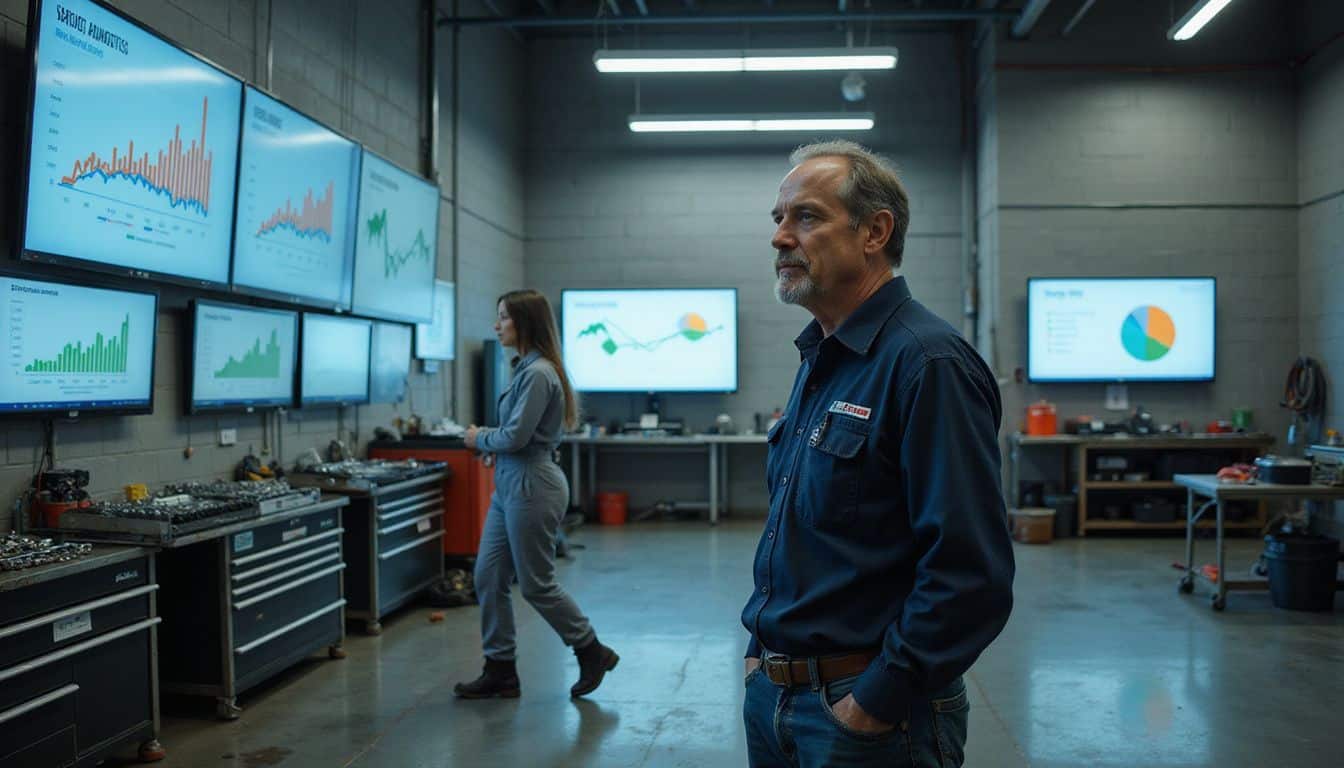
Your DMS connects straight to your digital signage, turning raw data into live performance displays your team sees every moment. Real-time KPI displays pull information from your dealership’s system and show technicians, advisors, and managers exactly where they stand on service revenue, parts sales, and customer satisfaction.
How Do You Sync DMS with Digital Signage?

Connecting your DMS to digital signage turns raw data into live performance displays your team sees every day. This setup pulls real-time metrics straight from your dealership system, keeping everyone informed without manual updates.
- Confirm your DMS provider supports API connections or data export features that link to digital signage platforms.
- Work with your IT team to build secure data pathways between your dealership management system and signage hardware.
- Set up automated data pulls that refresh your leaderboard metrics every 15 minutes.
- Map key performance indicators like repair orders, labor hours, and CSI to specific display zones on your signage.
- Test the connection thoroughly before going live to catch any gaps in data flow or formatting.
- Configure your dashboard to pull appointment scheduling, technician performance, and parts revenue automatically from the DMS.
- Assign admin access to team members who can monitor data accuracy and fix sync problems.
- Let automated syncing handle the heavy lifting, freeing your staff for coaching instead of manual reports.
- Share your dashboard storewide across multiple displays so accountability reaches every corner of fixed operations.
- Schedule regular audits of your synced data against DMS records to confirm ELR and op-code saturation rates display correctly.
One dealer IT team worked with the service manager to validate a secure API sync between the DMS and three displays, focusing on field mapping and audit cadence to prevent metric drift. The validation covered nine steps: API authentication, field mapping of 12 KPIs, test data pulls every 5 minutes for 24 hours, three formatting adjustments, and two audit cycles by the shop manager in week one. The team caught and fixed two op-code mismatches during those audits before settling on a final refresh rate of 15 minutes. The service manager noted that the field mapping catch on day one saved the team from misreporting effective labor rate, and the 15-minute cadence felt right for live coaching.
How Does Real-Time KPI Display Increase Transparency?
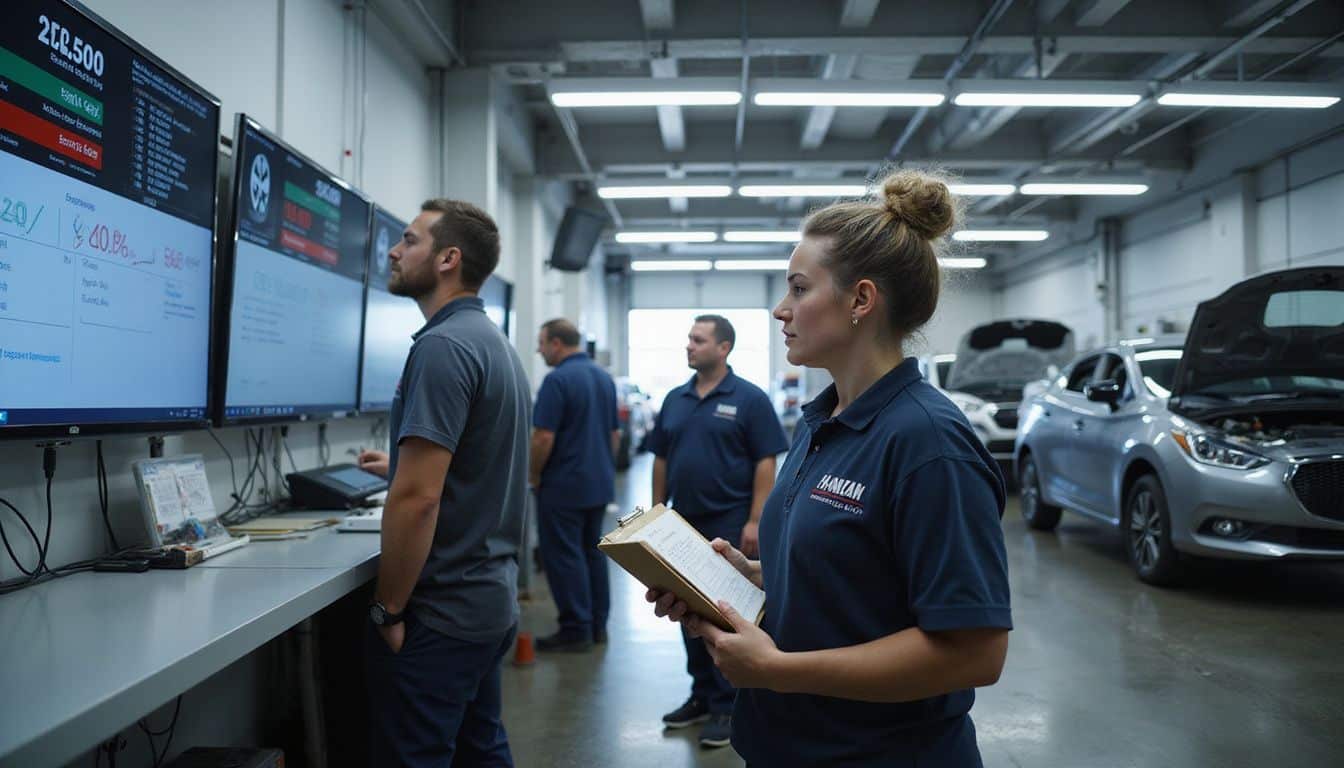
Once your DMS syncs with digital signage, the real payoff shows up on those screens mounted across your service department. Your team sees accurate repair orders, efficiency metrics, and labor rates refreshed every 15 minutes, creating a live scoreboard everyone watches.
This constant visibility changes how your advisors and technicians work. They know exactly where they stand against targets and peers, and storewide dashboards reinforce accountability because no one can hide behind excuses when the numbers show up in real time.
Transparency does something else too. It clarifies exactly how each KPI gets calculated and reported, which stops anyone from gaming the system or arguing about the math.
Real-time visibility gives your team a few clear wins:
- Faster decisions when performance gaps show up
- Healthy competition across your fixed-ops department
- Instant coaching moments before problems grow
- Industry benchmarks that feel like visible goals, not abstract targets
Data-driven course corrections happen quicker. Your accountability strengthens, and your service and parts revenue climbs because everyone works with full transparency about what matters most.
How Can You Drive Behavioral Changes in Service Teams?

Your service team responds to what they see on the screen every single day. Real-time leaderboards turn data into action, sparking friendly competition that lifts performance across your fixed-ops department.
What Are Effective Goals and Incentives for Teams?
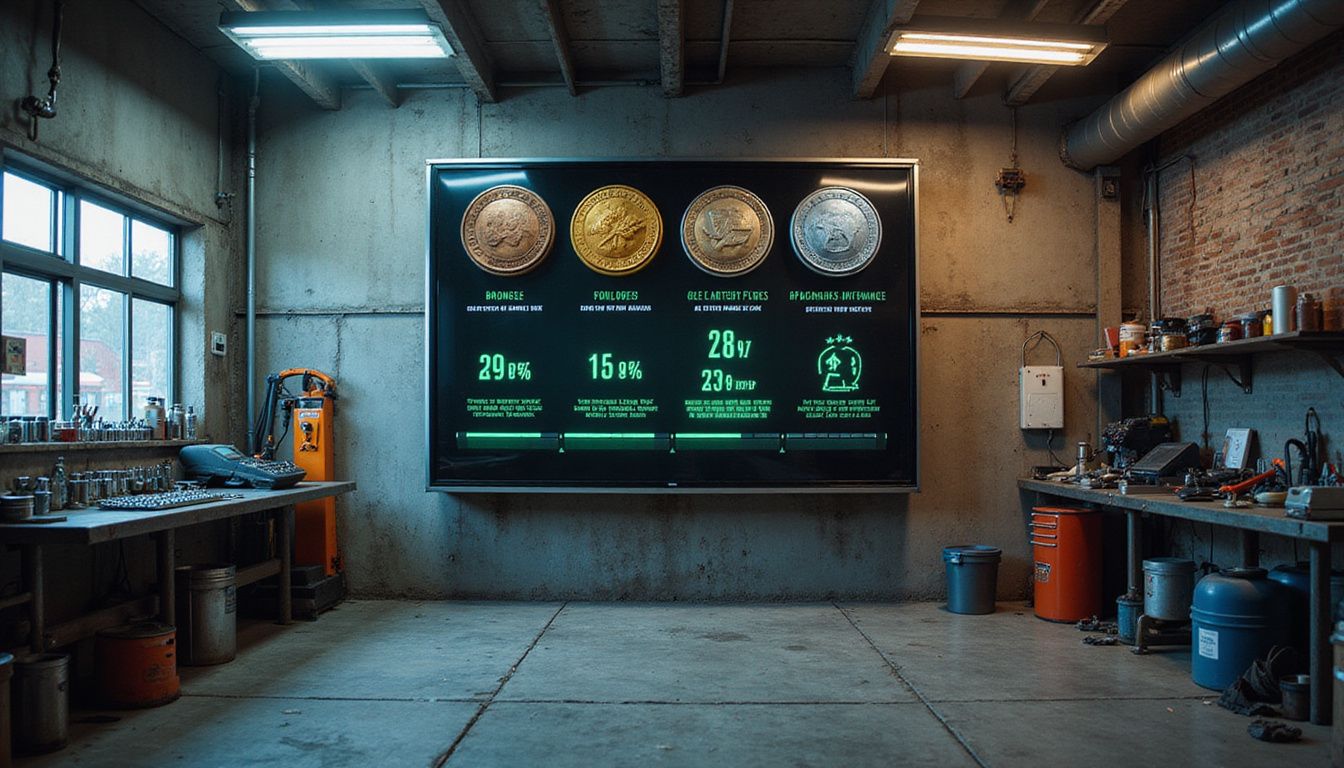
Setting clear incentives tied to real goals shows your team exactly what success looks like and what rewards they can earn for hitting it.
| Goal Category | Specific Target | Incentive Structure | How Digital Signage Supports It |
|---|---|---|---|
| Repair Order (RO) Value | Increase average RO value by $15 | Bonus payments for advisors hitting benchmarks; tiered rewards for consecutive months of achievement | Live RO metrics display real-time progress toward targets; advisors see performance instantly |
| Flat-Rate Efficiency | Raise flat-rate efficiency by 5 percent | Recognition bonuses tied to technician productivity; rewards for exceeding efficiency benchmarks | Leaderboards track efficiency gains in real time; technicians compete in a transparent, motivating environment |
| Metric Weighting System | 35 percent ROs, 25 percent Efficiency, 20 percent Hours, 20 percent CSI | Balanced scoring prevents over-focus on single metrics; rewards reflect overall shop performance | Digital displays show weighted performance breakdowns; team members understand contribution to total score |
| Tiered Ranking Structure | Set attainable targets across Bronze, Silver, Gold, Platinum tiers | Escalating rewards at each tier; entry-level achievement feels reachable; top performers earn premium bonuses | Signage displays current tier placement; visual progression motivates your team to climb rankings |
| Timebound Goals | Weekly, monthly, quarterly performance windows | Sprint bonuses for weekly wins; larger payouts for sustained monthly performance; year-end recognition | Real-time countdowns and progress bars keep urgency high; leaderboards refresh throughout each period |
| Behavior-Based Criteria | Reward customer follow-ups, direct resolution, upsell compliance | Incentives for actions that drive long-term revenue; capped rewards prevent unsustainable spending | Dashboard metrics highlight desired behaviors; your team sees which actions move the needle most |
| Advisor and Technician Benchmarks | Uniform performance standards across all shop roles | Clear expectations for each position; role-specific targets acknowledge different responsibilities | Segmented leaderboards show advisor performance separately from technician data; fairness is transparent |
| Shop Manager Oversight | Monitor team performance against established KPIs | Manager bonuses tied to shop-wide metrics; incentivizes coaching and support for individual growth | Managers access detailed analytics behind leaderboard data |
How Do You Coach Advisors and Technicians in Real Time?
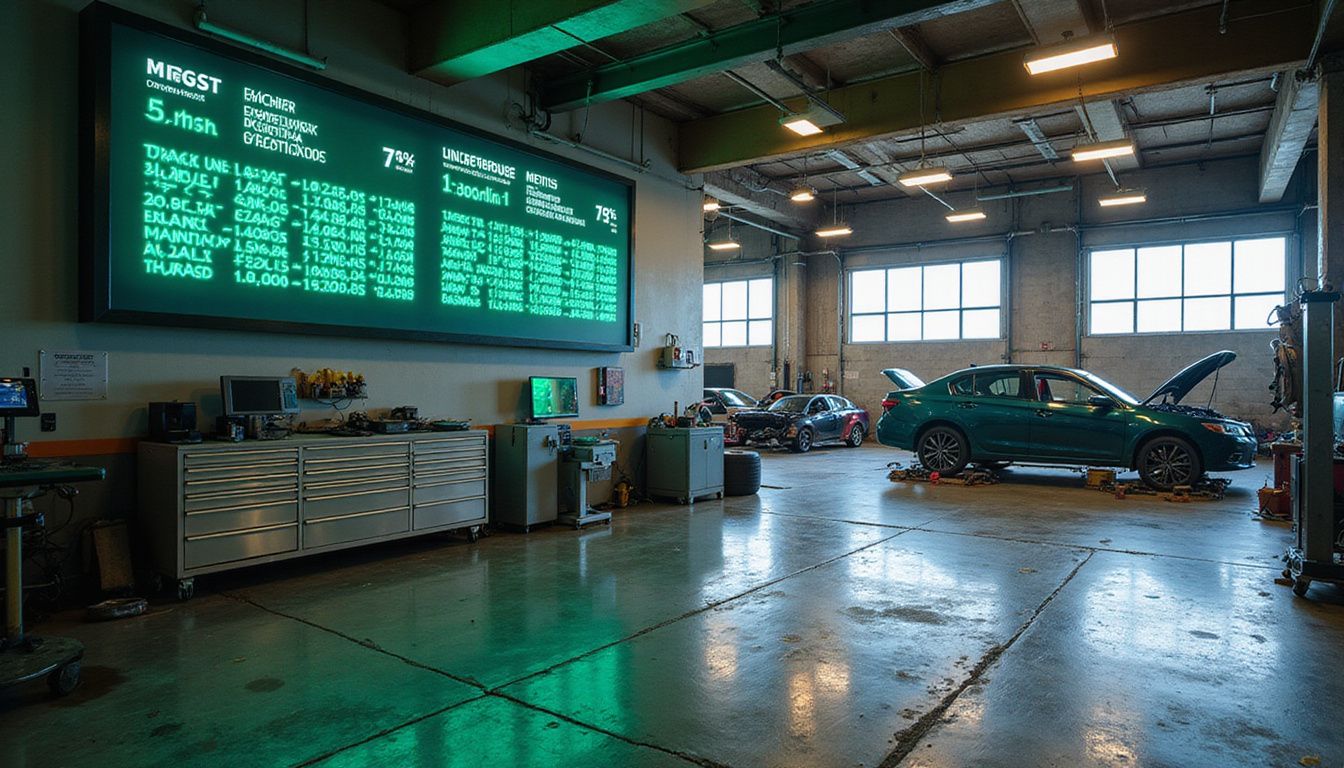
Your digital signage displays the performance metrics your team needs to see right now. Real-time visibility turns coaching from a monthly meeting into a continuous, immediate conversation.
- Post live leaderboard data on your digital signage so advisors and technicians spot performance gaps instantly and adjust before the day ends.
- Flag efficiency rate deviations the moment they happen, so you can coach on labor hours and cycle times without waiting for end-of-week reports.
- Highlight repair order trends on your displays so your team spots the upsell opportunities they’re missing and corrects course right away.
- Use your DMS integration to sync real-time KPI updates directly to signage, keeping everyone aligned without manual data entry.
- Coach based on specific skill gaps your audits reveal, linking training plans to the exact metrics each person needs to improve.
- Display effective labor rate performance so technicians see how their speed impacts profitability.
- Share audit summaries on your digital signage after coaching sessions, reinforcing what success looks like.
- Celebrate CSI improvements publicly through your signage, rewarding advisors who deliver great experiences during multi-point inspections.
- Show which team members hit their targets to build healthy competition without hurting morale or fairness.
- Schedule coaching cycles triggered by leaderboard trends, addressing performance dips before they turn into patterns.
Avoiding Pitfalls: Maintaining Fairness and Morale
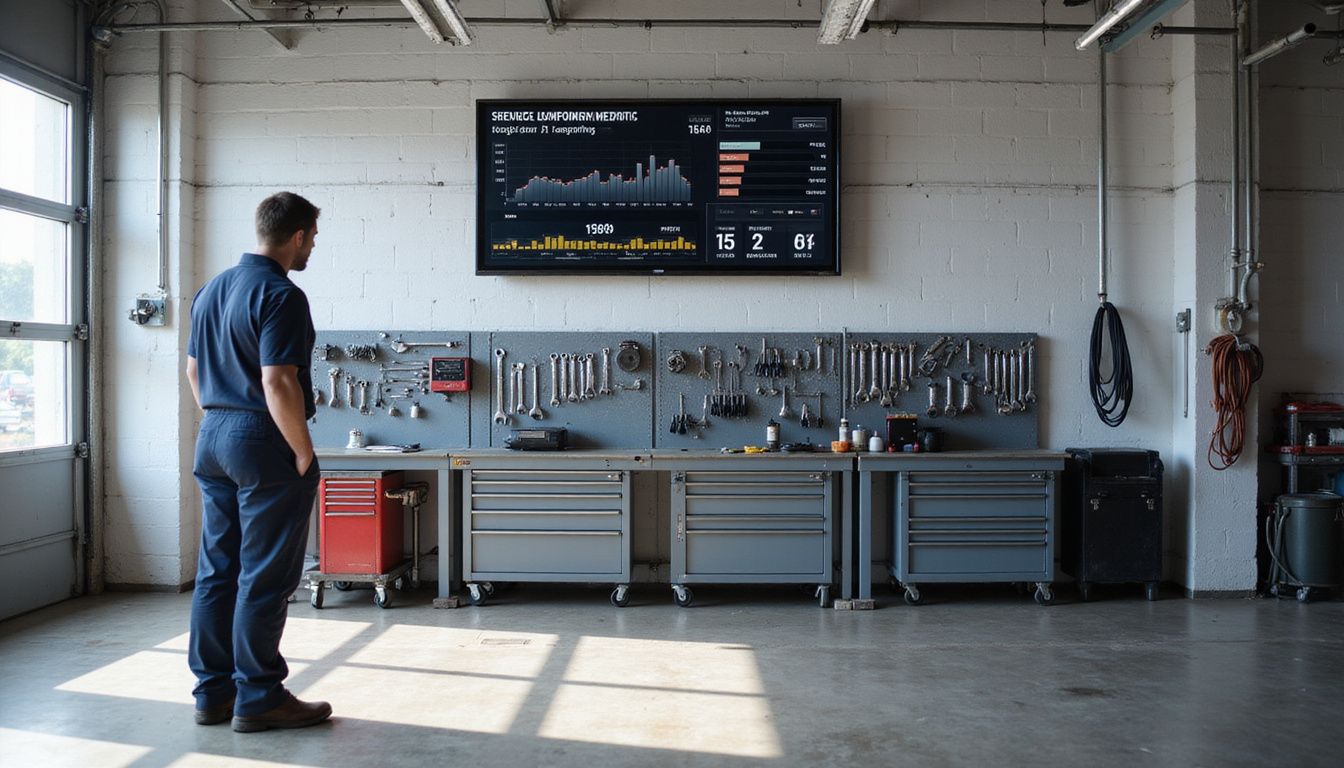
Your team members watch the leaderboard every single day, so you need to keep the competition fair and honest. When your service advisors and technicians see that rankings reflect real performance, not favoritism or broken metrics, they stay motivated and trust the system.
How Can Gamification Be Used Responsibly?

Gamification works best when it rewards fair achievement, not just high scores. Set timebound goals your team can actually reach within a set period, and cap your rewards so they don’t spiral into unsustainable payouts.
Focus on behavior-based criteria that measure real contributions to your service and parts revenue. Digital signage displays these leaderboards in real time, so your advisors and technicians see exactly how rankings work.
Transparent metrics prevent gaming and make clear how each KPI gets calculated. Your team learns that moving up the board means delivering real results, whether that’s completing more repair orders efficiently or lifting your customer satisfaction index. Tiered rankings help keep the environment motivating without crushing morale for those starting lower on the board.
Here’s what happens when weighting goes wrong. One dealership launched a leaderboard that leaned too hard on repair order volume.
| Weighting Model | ROs | Efficiency | Hours | CSI | Result After 30 Days |
|---|---|---|---|---|---|
| Original (RO-heavy) | 60% | 20% | – | 20% | ROs up 18%, CSI dropped 6 points |
| Rebalanced | 35% | 25% | 20% | 20% | CSI recovered, RO gains held |
Advisors chased volume and cut corners on customer interaction, and upsells declined because the board rewarded volume only. Management recalibrated to the balanced model, then ran two audit cycles to confirm it worked. Rebalancing the weights and publishing clear audit rules restored trust and stabilized satisfaction scores across the department.
Gamified guardrails keep your staff motivated without opening the door to manipulated scores. Pair your leaderboards with regular audits that verify the data feeding into them. A dealership using an automotive AI operating system can pull accurate information straight from its DMS and put it on digital signage instantly.
This transparency builds trust because your technicians understand the rules before they compete. Incentive structures need to reward behaviors that actually drive your business forward, like cutting labor hours waste or maintaining strong effective labor rates. Avoid arbitrary targets that feel disconnected from real work, and tie your engagement strategy to clear, measurable accountability.
Why Are Regular Audits and Transparent Metrics Necessary?

Your digital signage displays real-time fixed ops leaderboards, but those numbers mean nothing without verification. Regular audits and transparent metrics keep your team honest and your data trustworthy.
- Audits uncover gaps between reported figures and actual performance, catching errors before they hurt credibility with your service and parts teams.
- Cross-checking reported numbers against real-time dashboards prevents score gaming and keeps competition fair across your auto dealership.
- Tracking discrepancy rates and how you fix them gives you concrete proof that your CRM data stays accurate over time.
- Publishing audit summaries on your digital signage builds visibility, so advisors and technicians see that leadership takes accountability seriously.
- A standard audit cadence, run at shift and weekly intervals, gives your teams consistency they can rely on for ranking rules.
- Linking coaching plans to skill gaps found through audits keeps improvement focused on real problems, not just leaderboard position.
- Transparent metrics protect morale because teams understand the scoring system and know audits guard against manipulation.
- Regular checks on warranty labor rates and ELR calculations make sure your profit numbers reflect actual shop performance.
- Fair audits build trust in your digital dealership system, making teams more willing to embrace leaderboards instead of resenting them.
- Audits confirm that your real-time KPI display accurately reflects customer experience and service quality across fixed operations.
Conclusion

Real-time fixed ops leaderboards change how your service department runs. They put performance data right in front of your team every 15 minutes, so everyone knows exactly where they stand.
Connect your DMS to digital signage, and you erase the guesswork. You build accountability that motivates instead of frustrates.
Small wins add up fast. A $15 lift in average repair order value can generate roughly $1,500 in monthly revenue for a typical dealership.
Start today. Track what matters, and watch your service and parts revenue climb.
FAQs
1. What are fixed-ops leaderboards, and how do they help car dealerships?
Fixed-ops leaderboards display real-time metrics on service bay efficiency, parts sales, and technician productivity. Dealerships using platforms like Bizzycar can spot top performers instantly and identify areas that need attention. According to industry data, dealerships using real-time dashboards see service revenue lift by 12-18% on average.
2. How does Bizzycar’s sales AI and marketing AI work together to grow revenue?
Sales AI analyzes customer behavior and service history to predict who’s ready to buy, while marketing AI creates personalized campaigns based on those signals. Dealerships like Five Star Ford Dallas and North Georgia Toyota use this combo to turn service customers into car buyers.
3. What role does recall outreach play in fixed ops success?
Recall outreach brings customers back to the service drive for safety repairs they might have forgotten about. Recall Scout automates the process by pulling data directly from automotive manufacturers, making it easy to contact affected customers quickly.
4. Can chat AI and merchandising AI improve the customer experience at dealerships?
Chat AI handles common questions instantly, even when customers ask about mobile service appointments or part availability. Merchandising AI suggests relevant add-ons based on what’s in the service ticket, boosting average transaction value.
5. How does data from sources like S&P Global Mobility, Edmunds, and OEMs support Pulse and Presidio Group dealerships?
S&P Global Mobility, Edmunds, and OEM data feed the Pulse platform with accurate vehicle information, market pricing, and service intervals. Presidio Group dealerships use these insights to create competitive service packages and targeted outreach strategies.