Running a car dealership can get stressful fast. Many owners and managers struggle to see how each part of the store affects sales, profitability, and the customer experience. Without clear data, it is hard to spot what works or fix weak spots.
Dealertrack Performance Dashboards solve this problem with live views of key performance indicators, also called KPIs. These include profit metrics, sales tracking, and operational efficiency, all updated in real time. Teams use this information to make smart choices that improve return on investment, or ROI.
This article explains how these dashboards work for any size store or budget. Readers will see how simple tools make daily management easier and lead to stronger results on the lot and better profits each month. Ready to see what data integration could do for your dealership? Keep reading.
Key Takeaways
- Dealertrack Performance Dashboards show live KPIs like sales volume, profit per vehicle, and customer retention so leaders can track ROI with confidence.
- Managers get color-coded charts, simple visuals, and leaderboards that speed decisions and lift performance across departments.
- Automated digital signage powers live showroom updates, which helps upsells and customer engagement without extra work.
- Dealers report faster closings, stronger monthly sales, better efficiency, and higher profitability after using these analytics tools.
- The system fits any dealership size or budget, includes professional installation, and boosts both revenue and team motivation through active analytics use.

What are Dealertrack Performance Dashboards?
Dealertrack Performance Dashboards bring real-time analytics and performance metrics to car dealerships. Leaders and staff can watch sales optimization efforts in one place and act on them quickly. KPIs are explained in plain terms so new users do not feel lost.
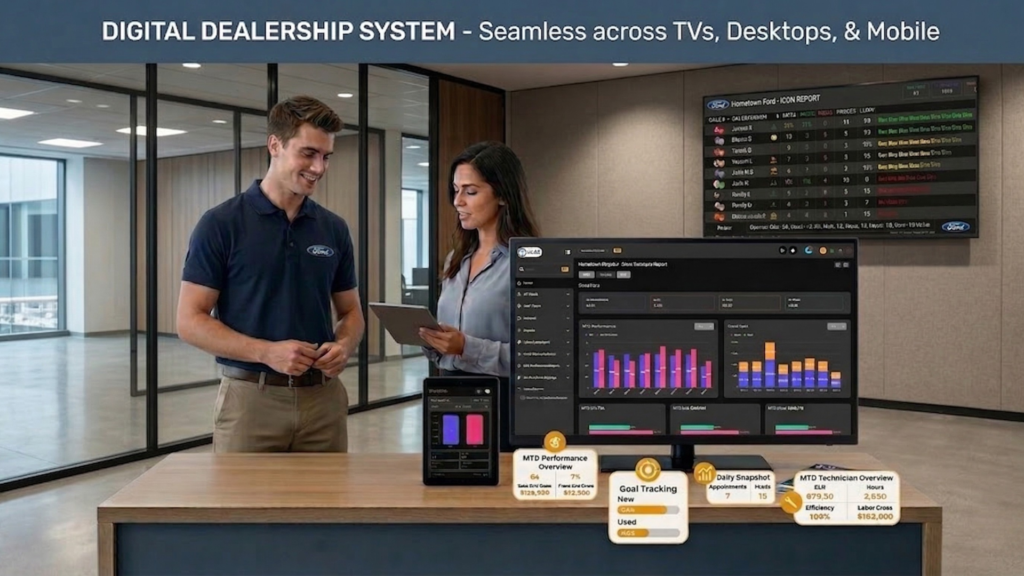
These dashboards are part of the Digital Dealership System. The platform helps stores increase customer engagement and improve dealership performance for both large groups and single rooftops. With automated digital signage built in, the showroom becomes a live marketing channel that updates itself.
Managers see team results with clear leaderboards and goal tracking. Custom options fit everything from one lobby screen to a full command center. Every install is handled by the Digital Dealership System crew, so setup runs smoothly.
Every department benefits, from sales to service. Quick insights show daily progress and reveal chances to improve profitability and operational efficiency. Next up, see how dealers measure ROI with Dealertrack’s most useful features.
How Can Dealers Measure ROI Using Dealertrack?
Dealertrack Performance Dashboards give instant access to the numbers that matter. Sales tracking, profit trends, and workflow timing all connect to ROI. The data links activity to outcome, which guides better business strategy. Here are the core metrics that drive results.
What Key Metrics Should Dealers Track for ROI?
Dealers need clear, repeatable numbers to learn what works. Strong data supports better return on investment and steady growth.
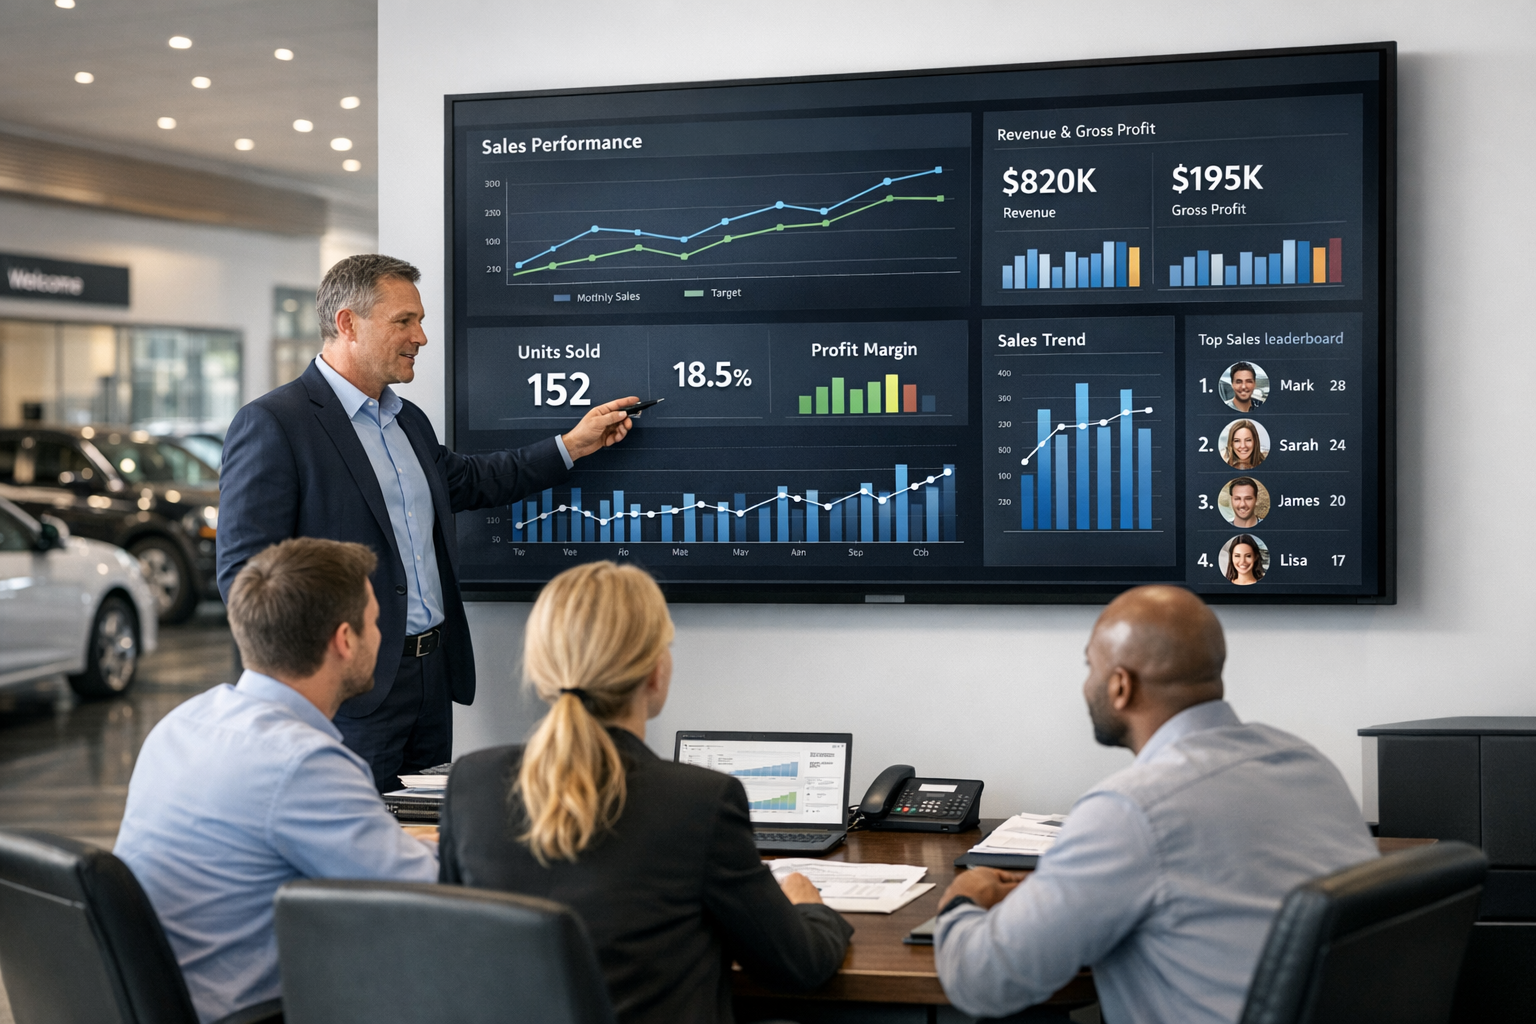
- Sales Effectiveness: Track closed deals each month against total leads. This shows how well interest becomes sold units.
- Gross Profit Per Vehicle: Watch profit per sale. Higher profit per unit signals smart pricing and better desking.
- Operational Efficiency: Time the steps for loan approvals, appraisals, and closings. Faster turnaround lowers costs and raises customer satisfaction.
- Customer Retention Rates: Measure repeat buyers and service return visits. Strong retention means people trust the store.
- Revenue Growth: Review year-over-year revenue across sales, finance, insurance, and service. Growth proves the plan is working.
- Lead Conversion Ratio: Track the percentage of website and walk-in leads that turn into buyers. This reveals marketing strength.
- Analytics Engagement: See how often teams use dashboard insights. Frequent use leads to faster fixes and better outcomes.
- Financial Health: Compare expenses, gross, and net profit margins. Healthy margins make gains last.
- Business Intelligence Trends: Use real-time reports to spot early shifts. Quick adjustments protect profitability.
Track these KPIs weekly and monthly. Short review cycles help managers react before small issues grow.
How Do Dealers Interpret Insights from Dealertrack Dashboards?
Knowing which metrics matter is a start. Turning insights into action is where wins happen. Managers use live KPI dashboards to watch how sales teams perform during the day.
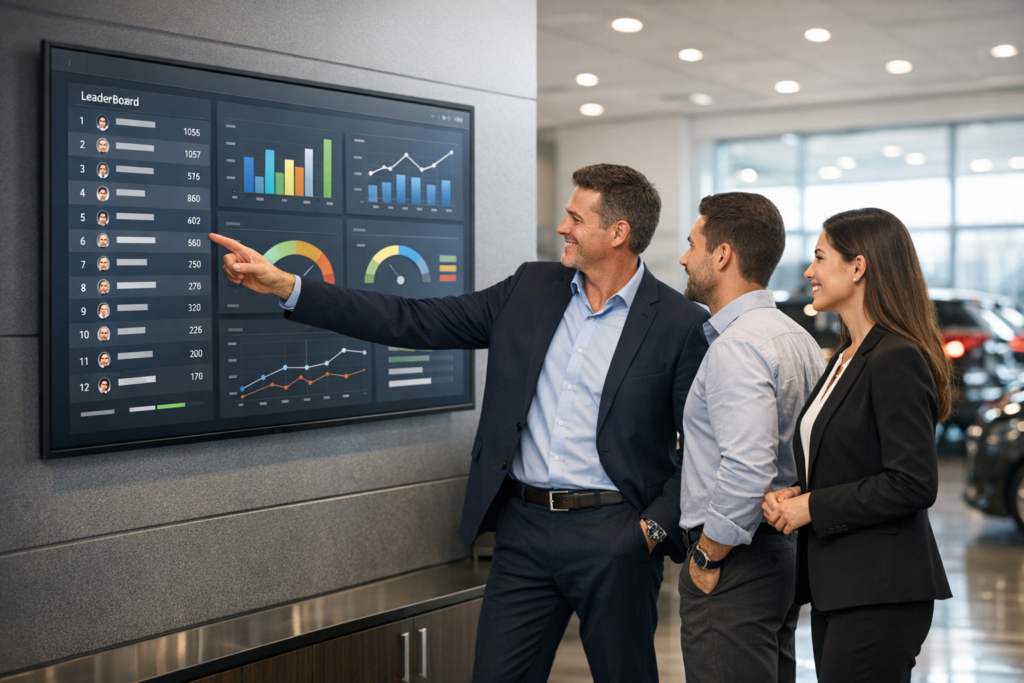
Color-coded charts and simple graphs make trends easy to see. Leaders can view customer engagement, sales analytics, and leaderboard rankings for each staff member or manager. Custom setups fit any size store or budget, so teams can read the data at a glance.
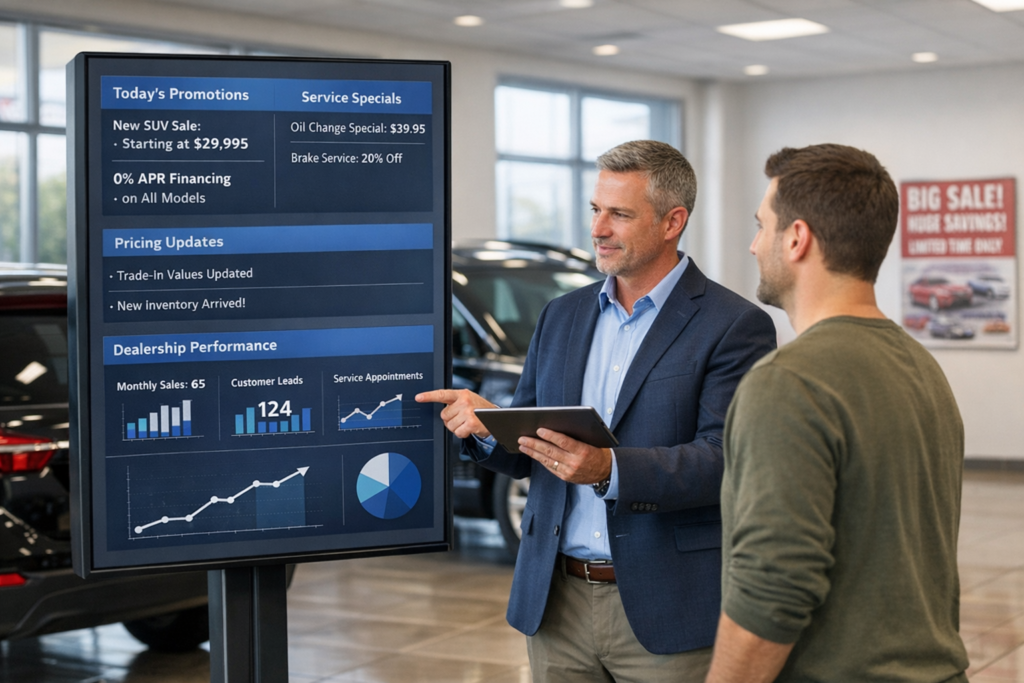
Underperforming areas stand out early. Automated digital signage shows live stats in the showroom and back office, no manual updates needed.
A fixed-ops manager said it best:.
“Our custom dashboards from Dealertrack show exactly what’s working—so we act fast to improve our results.”
Clear performance metrics help leaders measure ROI across departments and support faster, better decisions.
Real-World Results: Examples of Dealer Success
Dealers report higher profitability, smoother operations, and better sales tracking after adopting the dashboards. Smart data integration turns guesswork into predictable results. Here are examples of what stores are seeing.
What Success Stories Highlight Dealertrack’s Impact?
Dealertrack Performance Dashboards change how auto retailers track sales and efficiency. These tools spark innovation and make results visible right away.
- Sales cycle times drop, so vehicles sell faster and customers wait less.
- Insights lift team performance within weeks, which leads to higher monthly sales with the same staff.
- Customer experience improves because data shows where buyers slow down, so teams can fix those points quickly.
- Finance deals run smoother. Integrated tools cut paperwork time and reduce errors at closing.
- Store leaders track key metrics live, then adjust staffing, pricing, or offers on the fly.
- Large groups compare store results side by side, which helps share winning plays across locations.
- Efficiency rises as manual tasks shrink, freeing time for better customer service.
These stories show why many modern dealerships rely on Dealertrack for daily performance gains.
How Have Dealers Improved Performance Using Dealertrack?
After seeing the outcomes, it is clear the impact reaches daily work on the floor and in the office.
- Live KPI dashboards let managers watch sales numbers and staff progress in the moment. Fast reactions follow real trends.
- Automated digital signage highlights specials and current promos, which helps increase traffic and upsells.
- The Digital Dealership System fits any store size, from one showroom to a multi-rooftop group, with options for every budget.
- Performance leaderboards build friendly competition. Teams strive to beat last month’s best.
- Real-time analytics show what is working and what is not, so leaders can shift budgets or update promos fast.
- Professional installation keeps setup simple, which limits downtime and keeps focus on revenue growth.
- Visual communication tools inform shoppers and staff about vehicles, financing, and limited-time deals. Clear info builds trust.
- Competitive metrics show how the store stacks up locally with side-by-side data. Smarter plans follow each week.
- In-store promotions supported by Dealertrack tools often raise close rates and engagement right where buying happens.
- Whole-store optimization becomes real as front desk, sales, and service share insights that cut waste and improve efficiency each day.
Dealers are moving faster, making better choices, and seeing real gains with tools built for car retail.
Conclusion
Dealertrack Performance Dashboards bring clear data, fast insights, and easy ways to track KPIs. Stores make smarter choices, raise profitability, and improve the customer experience. The platform fits any budget and includes flexible digital signage for live showroom marketing.
Many dealers see stronger sales and better operational efficiency once analytics become a daily habit. Teams feel motivated when goals are visible and wins are shared. If stronger Return on Investment is the goal, these dashboards are a practical next step. Contact the team to schedule a quick demo and see the impact for yourself.
FAQs
1. What are Dealertrack Performance Dashboards and how do they help dealers measure ROI?
Dealertrack Performance Dashboards provide real-time analytics, tracking key performance indicators for dealerships. These dashboards show clear data on sales trends, finance deals, and customer engagement. Dealers can see which strategies drive the best return on investment, making it easier to focus resources where they matter most.
2. How do these dashboards deliver real-world results for automotive retailers?
The dashboards offer actionable insights by highlighting strengths and pinpointing areas needing improvement in daily operations. With accurate reporting tools, dealership managers can adjust processes quickly to boost efficiency and profitability. This leads to better decision-making that supports long-term growth.
3. Can Dealertrack Performance Dashboards integrate with existing dealer management systems?
Yes; these dashboards connect seamlessly with most major dealer management platforms used across the industry today. Integration is straightforward so your team gets up-to-date information without extra steps or manual entry—saving time while reducing errors.
4. Why should a dealership trust Dealertrack’s dashboard solutions over others?
Dealertrack has a proven track record of supporting auto retailers nationwide with certified technology solutions built specifically for this sector. The platform prioritizes security, accuracy, and ease of use at every step; plus ongoing support ensures you always have expert guidance when needed… Ready to see what your numbers reveal? Contact us now or visit our website for a demo tailored to your business needs!