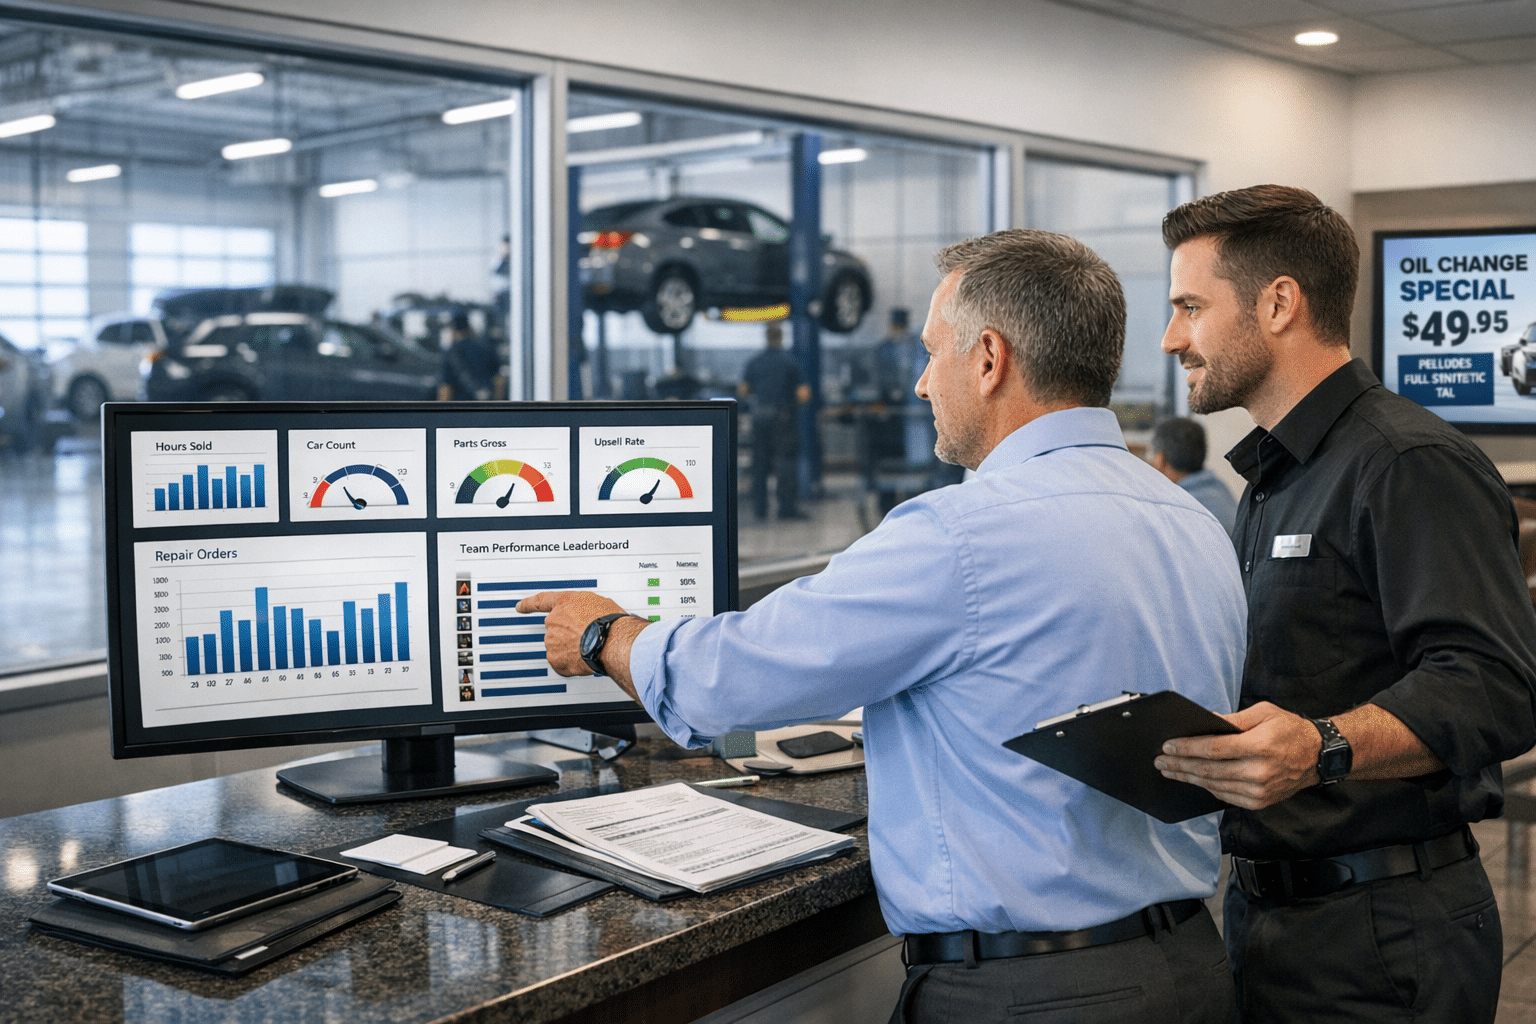
Many car dealers want stronger profit growth from fixed operations. Yet leaders often lack real-time insights into performance metrics, which slows decision making and hurts customer experience. Slow or unclear reports can block gains that should be within reach.
Digital Dealership System delivers live KPI dashboards and automated digital signage for any automotive store size. KPI means key performance indicator, a simple score that tracks progress. These tools make it easy to view staff performance, promote service specials, and engage customers in the lobby. This guide explains the top features of data analytics tools and how they raise revenue fast. Want bigger profits from service operations? Keep reading…
Key Takeaways
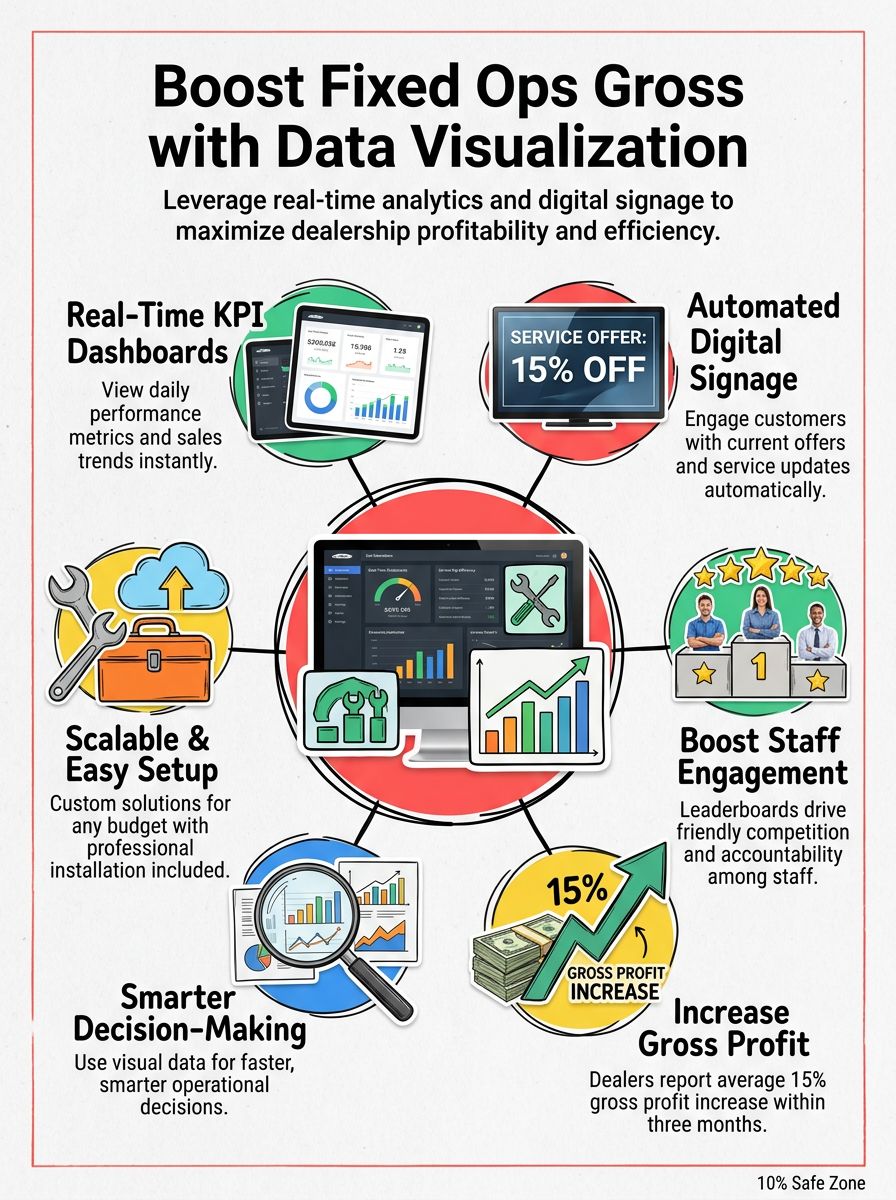
- Real-time KPI dashboards from Digital Dealership System help track staff performance and can lift gross profit by up to 15% in three months.
- Automated digital signage shows service specials, leaderboards, and customer updates, which speeds decisions and improves in-shop communication.
- Custom displays scale to any budget or store size, and every package includes professional installation for a smooth start.
- Clear reporting on technician hours, upsell rates, and repair orders supports better schedules, stronger motivation, and team accountability.
- Advanced analytics improve marketing plans, build trust with customers, and increase operational efficiency across fixed ops.
What Are the Key Features of Automotive Fixed Ops Data Visualization Tools?
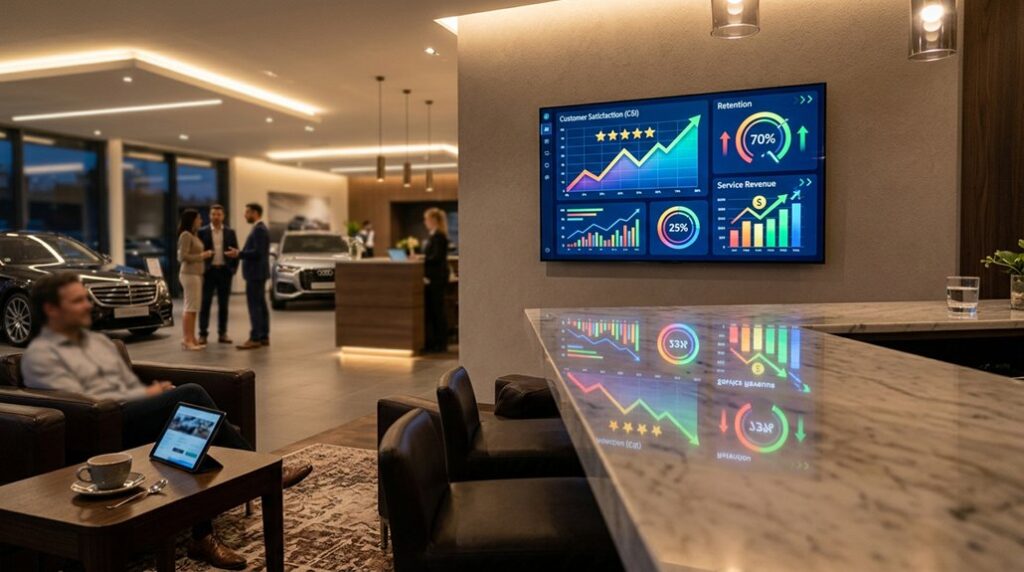
Automotive fixed ops data visualization tools give managers live KPI dashboards with real-time insights. Teams can see daily trends, spot issues early, and act before small problems grow.
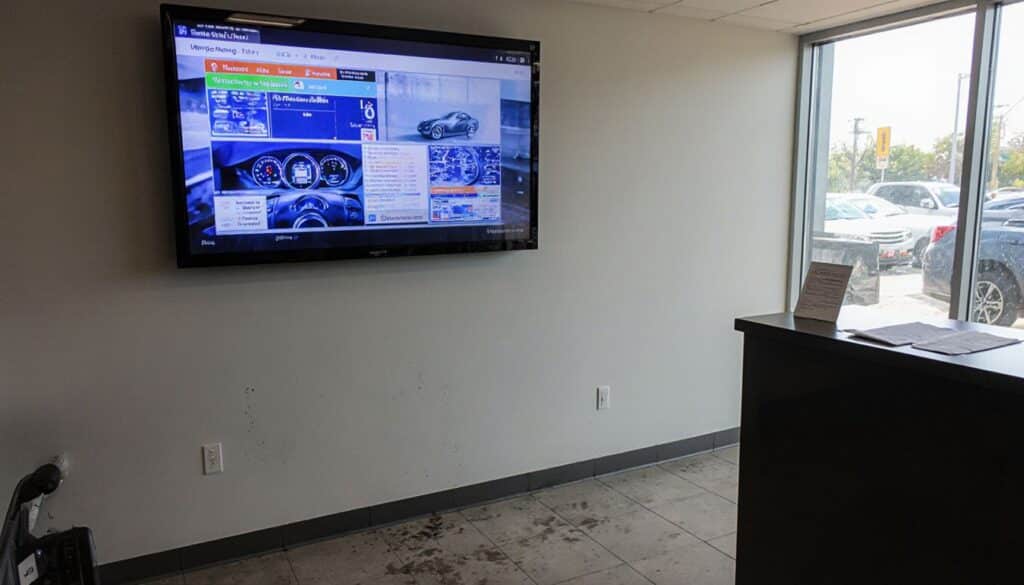
Leaderboards show performance for managers and staff, so goals stay clear and progress feels visible. Digital signage displays current offers and service updates on a single screen or across the entire dealership.
Custom digital signage works for any budget or layout. Installation includes professional service. No tricky setup or IT headaches.
Live monitoring supports faster decision making, and visual communication keeps everyone on the same page. Together, strong KPI reporting and in-store engagement tie analytics to action customers can see.
Top Tools to Boost Gross in Fixed Ops Departments
Many dealerships now use advanced visualization tools to track metrics and grow revenue quickly. The right setup turns raw numbers into clear actions that lift profit and speed up shop flow.
Which Tools Are Best for Increasing Fixed Ops Revenue?
Digital Dealership System stands out with live KPI dashboards made for fixed ops. Managers and advisors can watch key metrics in real time to guide staffing, pricing, and offers. Automated digital signage keeps customers informed about current maintenance deals and warranty options, which raises add-on sales.
Dealer management features include leaderboards that spark friendly competition and support coaching. Solutions scale from one screen to a full, multi-department network. Every system includes professional installation from the Digital Dealership System team, so stores run smoothly on day one.
Interactive displays highlight the most important KPIs, which helps leaders make quick, data-driven choices that push revenue higher.
“Dealers using live analytic dashboards saw an average 15% gross profit increase within three months,” reports Digital Dealership System’s executive director.
How Do These Tools Improve Fixed Ops Performance?
Once the right tools are in place, daily performance improves fast. Real-time KPI dashboards track essential numbers each day, such as hours sold, car count, and parts gross. This makes it easier to plan work, reduce bottlenecks, and keep bays full.
Easy-to-read leaderboards motivate teams and show steady sales improvement over time. Automated digital signage updates promotions and services instantly, which increases customer engagement in the lounge and at the cashier.
Scalable, custom options fit almost any budget. Smart data analytics turn trends into clear next steps, so managers can schedule better, coach faster, and grow gross without guesswork.
How Can Data Visualization Benefit Automotive Fixed Ops?
Clean visuals give service leaders a sharp edge in daily decisions. Real-time KPI dashboards display performance at a glance, so teams can spot wins or dips right away. One manager might notice low upsell rates before lunch and adjust scripts that same day.
Sales leaders use clear reports to track technician hours, upsell rates, and repair order trends. Digital signage shows service specials and appointment updates in seconds, which builds trust and raises satisfaction scores in the waiting area.
Accountability improves with simple staff leaderboards that encourage healthy competition among advisors and techs. Even small stores can choose tools that match their budget and still get big results.
Marketing gets stronger with targeted messages on automated screens for seasonal checks and recall reminders. Top providers handle installation in person, so systems perform well from day one. Managers can focus on growth and customer care, not on screens or cables.
Modern automotive fixed ops analytics keep operations efficient and teams aligned, which supports steady revenue gains month after month.
Conclusion
Choosing the best automotive fixed ops data visualization tools can transform a dealership’s service lane. Real-time insights and smart dashboards help managers act quickly on performance metrics and keep the shop flowing.
Better analytics lead to profit growth, improved customer experience, and tighter scheduling. Digital Dealership System fits any size or budget, which boosts efficiency and gross profit without extra hassle. Ready to bring clarity to your numbers and raise revenue? Visit Digital Dealership System to explore how analytics can support your service operations today.
FAQs
1. What are the best automotive fixed ops data visualization tools for boosting gross profit?
Top-tier solutions like Tableau, Power BI, and CDK Global’s analytics suite help service managers track key performance indicators in real time. These platforms transform raw repair order data into clear dashboards, making it easy to spot trends and drive higher gross margins.
2. How do these tools improve decision-making in fixed operations?
Data visualization software organizes complex shop metrics into simple charts and graphs. This clarity lets you quickly identify bottlenecks or missed revenue opportunities across your service department; you can then act fast to optimize labor hours, parts sales, and customer retention.
3. Why should dealerships invest in advanced data visualization for their service departments?
Dealerships using robust analytics gain a competitive edge by uncovering hidden patterns within daily operations. With accurate insights at your fingertips, you reduce guesswork—boosting efficiency while maximizing every dollar earned from each repair order.
4. Can these platforms integrate with existing dealership management systems?
Most leading automotive fixed ops data visualization tools offer seamless integration with popular DMS providers such as Reynolds & Reynolds or Dealertrack. This means no manual uploads or duplicate entry; all your critical numbers flow directly into one unified dashboard for smarter business decisions every day… Ready to see how much more profitable your shop could be? Call us today or visit our website to schedule a demo!