
General managers need quick, clear views of dealership health. Many spend hours piecing together numbers across systems, which slows smart choices. The right reporting software turns scattered data into simple views anyone can use.
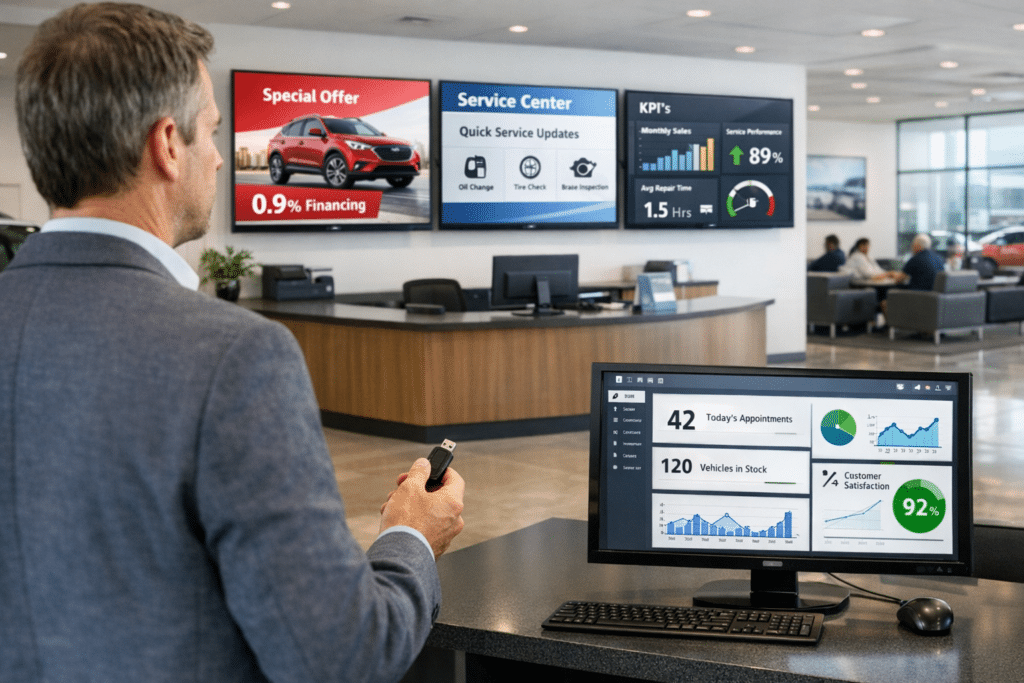
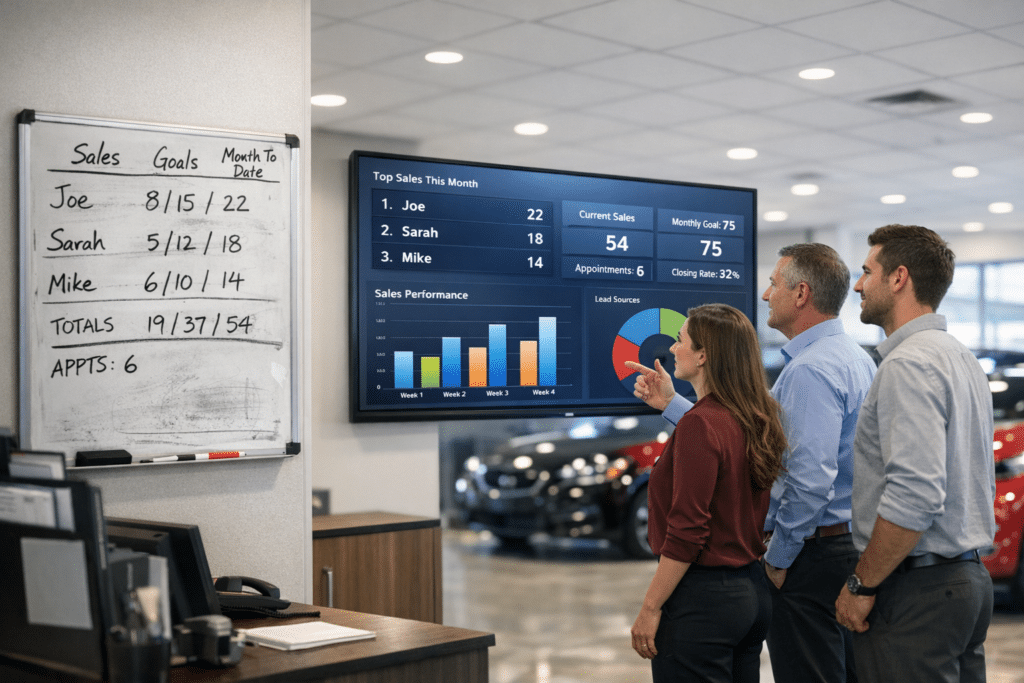
One standout option is DDS. It offers real-time KPI dashboards and automated digital signs for dealer showrooms and service lanes. Teams get quick snapshots, friendly leaderboards, and clean data visualization that scale from one rooftop to many.
This guide shares the best automate DMS reporting dashboard alternatives for GMs, including Microsoft Power BI, Tableau, Looker Studio, Zoho Analytics, and more. It also covers the features that matter most, plus tips to make performance tracking easy. Spend less time collecting numbers, and more time improving results.
Key Takeaways
- Automated DMS reporting dashboards like DDS, Power BI, Tableau, Looker Studio, and Zoho Analytics give GMs real-time KPIs and faster decisions.
- Must-have features include live refresh rates, CRM and accounting integration, custom visuals, drag-and-drop builders, and scheduled reports.
- Platforms such as Whatagraph and Domo combine sales, service, marketing, and finance data in one place for instant performance tracking.
- Automation saves hours each week by removing manual report work with synced data and timed delivery.
- The right dashboard tool turns raw business metrics into clear insights that drive better moves across every department.
Top Automated DMS Reporting Dashboard Alternatives for GMs
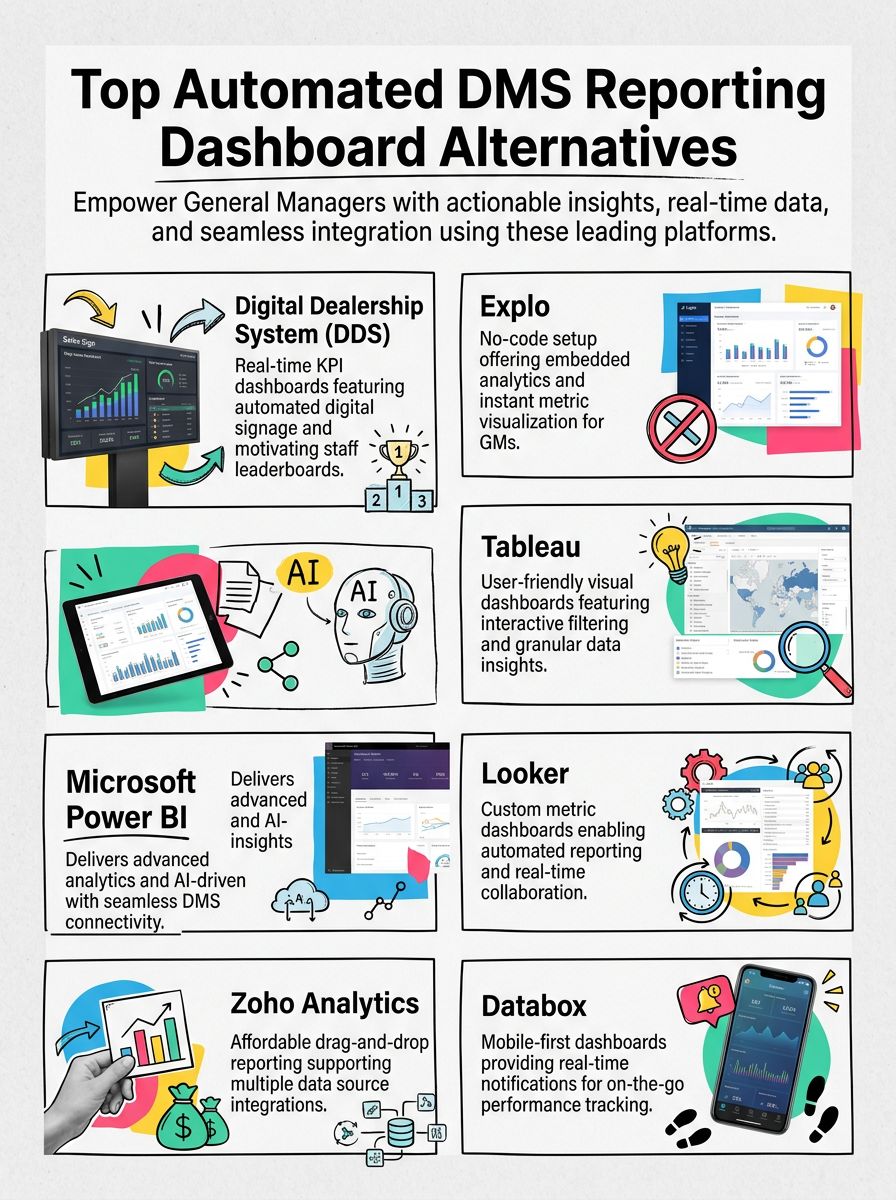
Automated DMS reporting dashboards give leaders fast insights, stronger performance tracking, and simple automation. Below are leading dashboard tools that deliver real-time data visualization, easy setup, and flexible reporting options.
| Dashboard Tool / Platform | Key Features | Benefits for GMs | Integration & Automation | Industry Focus |
|---|---|---|---|---|
| Digital Dealership System (DDS) |
|
|
| Automotive dealerships |
| Explo |
|
|
| Multi-industry, dealership ready |
| Microsoft Power BI |
|
|
| All industries, includes automotive |
| Tableau |
|
|
| Multi-industry focus |
| Looker Studio |
|
|
| Enterprise, automotive supported |
| Zoho Analytics |
|
|
| Business, automotive compatible |
| Databox |
|
|
| All industries |
| Whatagraph |
|
|
| Marketing, dealership friendly |
| Domo |
|
|
| Enterprise, includes automotive |
What features should I look for in a DMS reporting dashboard?
General managers need clear insights, fast access, and simple controls. A strong dashboard cuts noise and highlights what matters most. DMS means dealership management system. CRM means customer relationship management. KPI means key performance indicator.
- Usability and User-Friendly Design
Easy navigation speeds up work. Clean menus, clear layouts, and in-app tips help any staff member build or view reports. - Integration Capabilities with Other Systems
Connect the dashboard with CRM, accounting, inventory, and ad platforms. One source of truth reduces errors and double entry. - Real-Time Data Availability and Refresh
Live updates lead to faster action. Fresh metrics show what is happening right now, not last week. - Automation for Report Generation
Schedule reports to send daily, weekly, or monthly. Save hours as updates arrive in inboxes without manual effort. - Customization Options for Visual Representation
Choose colors, layouts, and chart types to match how leaders read data. Clear visuals speed up decisions. - Drag-and-Drop Interface for Report Creation
Build custom views by dragging fields into place. No coding skills needed for most use cases. - Cross-Departmental Data Integration
Combine sales, service, parts, and finance data in one view. Spot links between leads, RO count, and gross profit. - User Experience Enhancements
Fast setup, responsive support, and simple training drive staff adoption. Teams use the tool more when it feels easy. - Performance Metrics Tracking
Track key numbers like units sold, gross per vehicle, RO cycle time, and turn rate on one screen.
With these features in place, leaders can compare dashboard tools with confidence.
How can automated dashboards benefit general managers?
Automated dashboards pull data from many sources, then present it in one clear place. Leaders see performance tracking in real time across sales, service, marketing, and finance. That reduces guesswork and shortens meetings.
Top analytics platforms, including Whatagraph and Domo, connect DMS data with other reporting solutions. When CRM, inventory, and ad spend align, trends become obvious and actions get clear. For example, a GM can link slower lead response times to lower weekend sales, then adjust staffing.
Tableau also helps surface patterns like technician efficiency or inventory turn. Reports refresh on a schedule, so numbers stay current during the day.
Automated dashboards help general managers make smarter decisions faster by putting the most important metrics right at their fingertips.
Conclusion
Picking the right dashboard tools pays off fast. Modern reporting software delivers clean data visualization, automated reporting, and clear business metrics in seconds. Options like Tableau, Power BI, and DDS help teams move from raw data to real decisions.
Start simple. Choose one priority metric, set an auto-delivered scorecard, and review it daily. Then add more views as the team gets comfortable. Ready to compare solutions and boost results today?
FAQs
1. What are the top alternatives to Automate DMS Reporting Dashboard for General Managers?
Several robust solutions stand out, including Dealertrack Analytics Suite, Reynolds and Reynolds Power Reporting, CDK Global Dashboards, and AutoMate Insights Platform. Each platform offers advanced reporting tools tailored for dealership management needs.
2. How do these dashboard alternatives improve daily operations for GMs?
These platforms deliver real-time data visualization, customizable reports, and automated alerts that help managers track sales performance, inventory levels, and service metrics with ease. This means faster decision-making and more control over dealership outcomes.
3. Why should a GM consider switching from their current DMS reporting tool?
Switching can unlock better integration with existing systems, enhanced user interfaces designed for speed and clarity, plus stronger security features to protect sensitive business information. Many options also provide mobile access so you stay connected wherever your day takes you.
4. Where can I learn more or request a demo of these alternative dashboards?
Visit each provider’s official website or contact their support teams directly to schedule personalized demos or receive detailed product brochures. For immediate guidance on choosing the right fit for your store’s unique requirements—call our consulting team today; expert advice is just one conversation away!