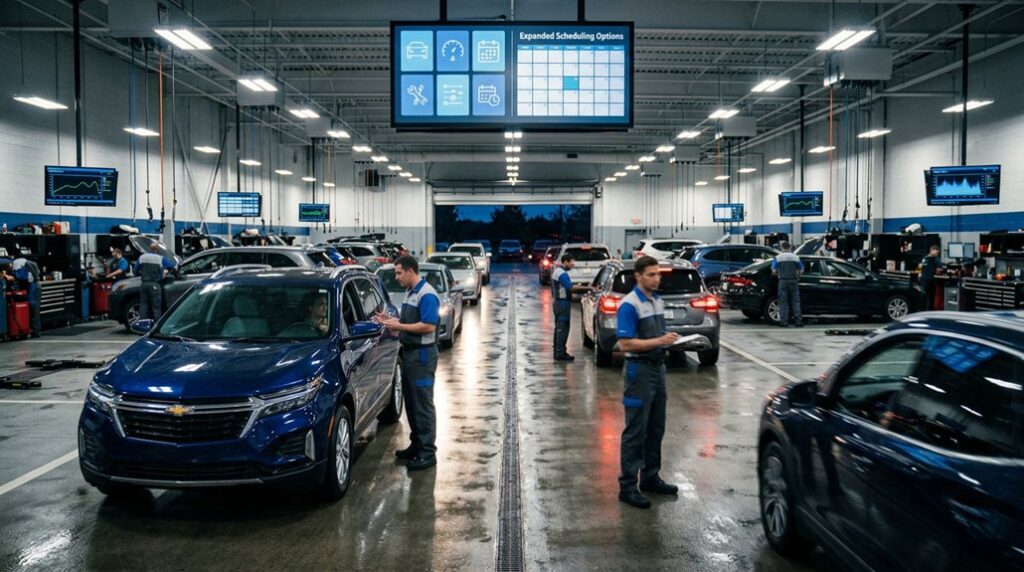
Are you trying to make the most out of your service department’s work hours? You might be looking for ways to get better results without pushing your team too hard. Good news: there’s a tool that can help with just that.
It’s called the Digital Fixed Ops Leaderboard, and it’s changing how automotive service departments operate.
This digital tool makes managing a team smoother by using data to show who’s doing what and how fast. Now, instead of guessing, managers see right away where things are great or could use some work.
This blog will guide you on using this leaderboard to boost technician performance and grow profits in an easy-to-understand way. Keep reading to learn more!
Key Takeaways
- The Digital Fixed Ops Leaderboard tracks technician performance using real-time data. This helps managers see who works fast and well.
- Using this tool can raise profits by 28% and improve tech efficiency by 42% in a year.
- It boosts teamwork and competition among technicians, leading to better work.
- Happy customers often come back thanks to faster service from efficient teams.
- Dealers use the leaderboard’s features like performance rankings and service metrics for smarter work planning.
Understanding the Digital Fixed Ops Leaderboard for Technicians

The Digital Fixed Ops Leaderboard helps technicians track their performance. It shows how well they work compared to others, using clear data and rankings.
What is it?

A Digital Fixed Ops Leaderboard is a tool that helps car dealerships manage their service operations. It uses real-time data to track and measure technician performance. This leaderboard ranks dealers based on key service metrics.
It provides insights into how well each dealership performs in fixed operations.
With the leaderboard, dealerships can see average completion times for service orders. This tracking helps optimize workload capabilities and improve CSI performance. By utilizing digital tools, companies can enhance technician productivity and streamline service operations efficiently.
Forward-thinking dealers have seen profits increase by 28% and technician efficiency rise by 42% within just 12 months after using this technology.
How does it work?

The Digital Fixed Ops Leaderboard works by measuring technician performance using real-time DMS data. It tracks service orders and average completion times. This data helps managers see how each technician is doing in their tasks.
Service metrics are displayed clearly, allowing for easy comparisons.
By ranking dealers based on these metrics, the leaderboard highlights areas needing improvement. It encourages competition among technicians while promoting teamwork. Forward-thinking dealers noticed a 28% increase in fixed operations profit within 12 months of using these tools.
Technician efficiency also rose by 42%. This demonstrates how the leaderboard optimizes service operations and boosts gross profit growth in automotive services.
Main features and functionalities

The Digital Fixed Ops Leaderboard offers key tools to improve service operations. It helps track and boost technician performance.
- Performance Rankings
It ranks technicians based on their work. This feature allows managers to see who performs best. They can reward top performers and motivate others to improve. - Service Metrics
Real-time data shows how long each service takes. This helps managers spot delays and fix them quickly. Tracking these metrics leads to better time management strategies. - Competitiveness and Teamwork
Leaders foster a spirit of competition among teams. Technicians want to climb the rankings, which boosts morale. This teamwork often leads to increased efficiency and productivity. - Real-Time Data Analysis
The leaderboard uses live data from daily operations. It keeps track of service orders and average completion times. Managers make better decisions with up-to-date information. - Enhanced Customer Satisfaction
Faster service improves customer reviews (CSI performance). When customers are happy, they return for future services. Satisfied clients also refer others, helping grow business. - Workload Optimization
Managers can allocate tasks based on technician strengths. This ensures that everyone is working at their best capacity, maximizing workload capabilities. - Insights into Dealer Performance
The leaderboard provides a clear view of how different dealerships perform against each other in service metrics. This allows for effective evaluation of automotive leaders in the industry. - Improved Decision Making
With all service metrics in one place, leaders can quickly assess what changes are needed in operations management for better efficiency. - Labor Utilization Strategies
Data-driven insights help businesses use their labor force wisely, making sure every hour counts toward productivity gains. - Monitoring Service Orders
The tool continuously tracks all active service orders, helping keep everything on schedule while reducing waste in service operations management.
Using these features results in fixed ops profit growth by improving technician productivity significantly over time—up by 42% within just 12 months with proper implementation!
Key benefits for service operations transformation
The Digital Fixed Ops Leaderboard helps service operations improve efficiency and productivity. This tool provides clear insights into technician performance.
- Real-time data analysis lets leaders see how technicians work. It tracks service orders and average completion times. This helps managers make quick adjustments when needed.
- Improved decision making is essential for growth. With accurate data, managers can spot trends and issues right away. This leads to better planning and resource use.
- Increased efficiency and productivity come from optimized processes. Forward-thinking dealers report a 28% rise in fixed operations profit after using these tools.
- Enhanced customer satisfaction boosts loyalty and retention rates. Satisfied customers are more likely to return for future services and recommend the dealership to others.
- Performance rankings create healthy competition among technicians. They can see where they stand compared to others, which motivates them to improve their skills.
- Service metrics provide detailed insights into each technician’s output. Tracking this data allows dealerships to allocate workloads fairly, maximizing each technician’s potential.
- Monitoring service orders ensures timely completion of tasks. Keeping track of these orders reduces waste in service operations, leading to better overall management.
- Evaluating automotive leaders based on service metrics allows for benchmarking against competitors. Dealers can adopt best practices that drive operational optimization.
- Digital tools utilization makes it easier for staff to access critical information quickly. This leads to faster responses to customer needs while enhancing technician productivity.
- Leveraging leaderboard analytics supports strategic planning for the future, allowing dealerships to adapt methods as necessary, ensuring continuous improvement in service operations.
Streamlining and Optimizing Service Operations with the Leaderboard

The Leaderboard helps service teams work better and faster. It shows real-time data to aid quick decisions. This boosts efficiency and improves customer satisfaction. Find out how it can transform your operations today!
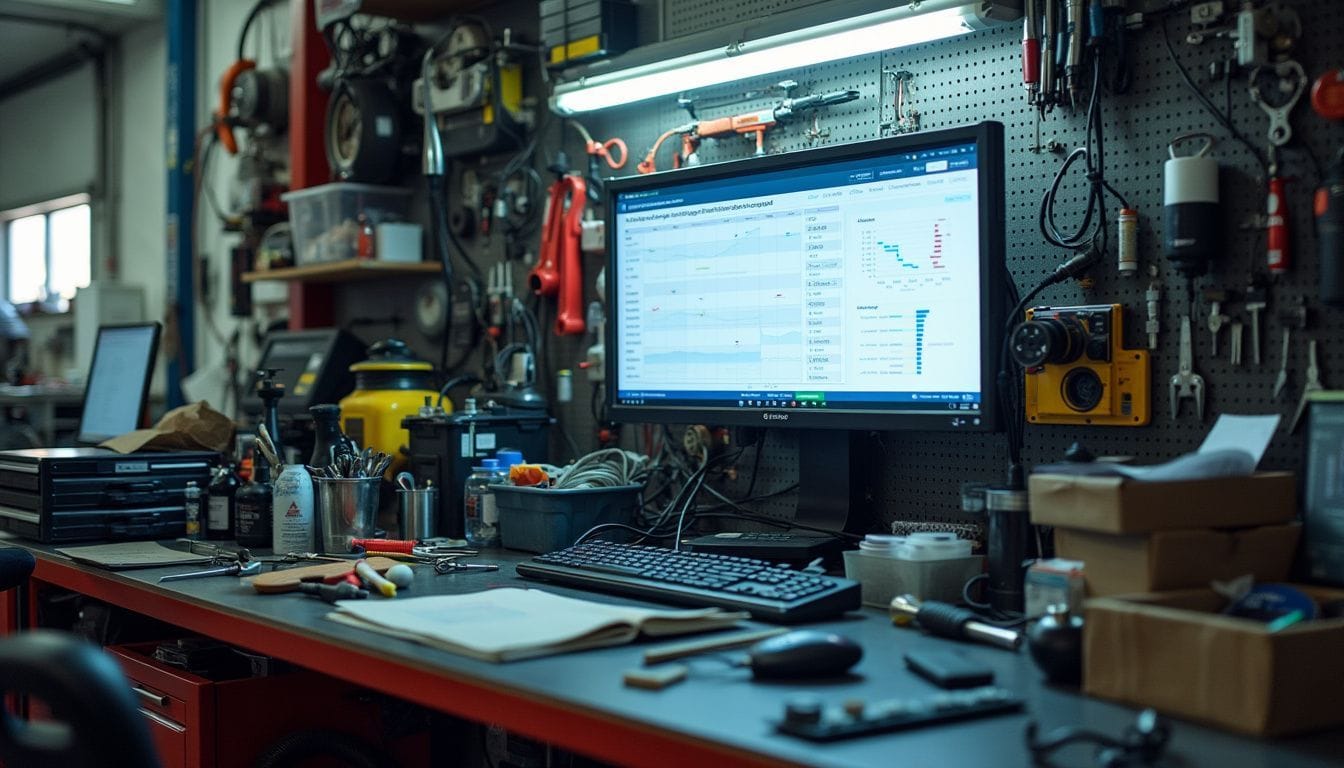
Real-time data analysis
Real-time data analysis is crucial for optimizing technician hours. This technology measures technician performance using live DMS data. It tracks service orders and average completion times effectively.
With this information, managers can make better decisions quickly. Increased efficiency and productivity result from using current data.
Dealers gain valuable insights into their operations through the Fixed Ops Leaderboard. It ranks them based on service metrics, helping to identify strengths and weaknesses. Forward-thinking dealers saw fixed operations profit increase by 28% after adopting these tools.
Technician efficiency rose by 42% in just one year with improved workload optimization strategies.
Improved decision making
The Digital Fixed Ops Leaderboard helps improve decision making in service operations. It uses real-time DMS data to measure technician performance. This data shows how well each technician completes their tasks and their average completion times.
With this information, managers can quickly see who is performing well and who may need extra help.
This leaderboard also ranks dealers based on service metrics. These rankings provide valuable insights into dealer performance across all areas of dealership operations. Forward-thinking dealers saw fixed operations profit increase by 28% after using these tools.
Technician efficiency jumped by 42% in just 12 months too. Utilizing digital solutions like the Leaderboard allows for better workforce allocation and improves overall service management.
Increased efficiency and productivity
Efficiency and productivity rise with the Digital Fixed Ops Leaderboard. This tool improves service operations management. It reduces waste, which saves time and resources. Dealers who used these tools saw fixed operations profit increase by 28%.
Technician efficiency also grew by 42% in just 12 months.
Real-time DMS data tracks technician performance clearly. It monitors service orders and average completion times effectively. Staff can see their rankings based on service metrics.
This encourages better teamwork and healthy competition among technicians, leading to higher job satisfaction and better results for the dealership.
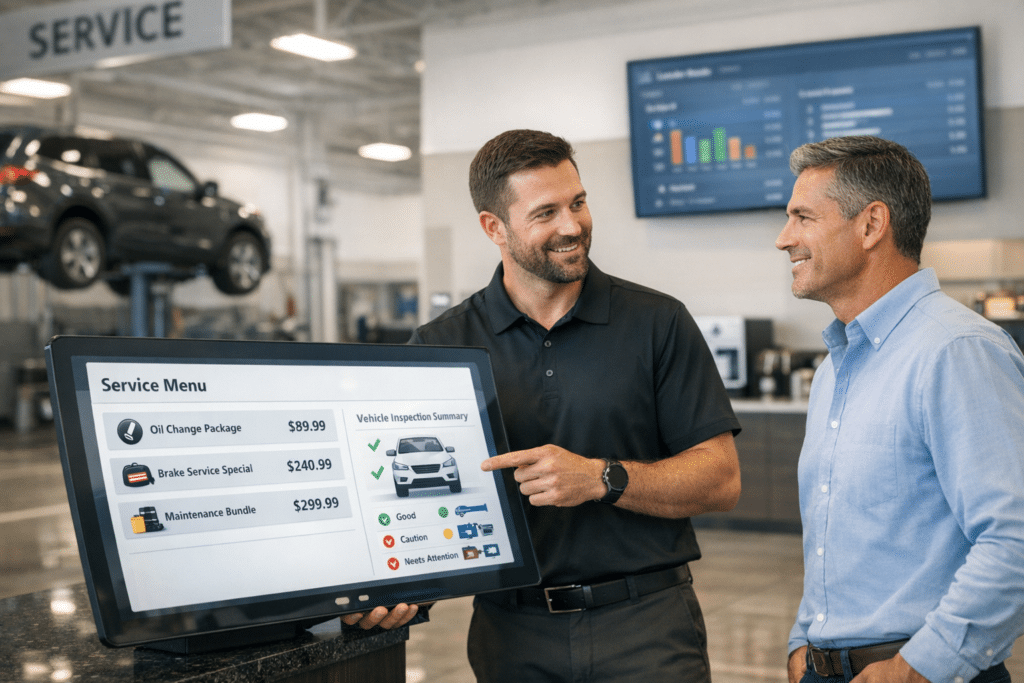
Enhanced customer satisfaction and retention
Utilizing the Digital Fixed Ops Leaderboard boosts customer satisfaction and retention. It provides real-time data on service operations. This data helps teams make better decisions quickly.
Improved service efficiency leads to faster repairs and less waiting time for customers.
Forward-thinking dealers saw a 28% increase in fixed operations profit after using these tools. They also improved technician efficiency by 42% in just one year. Happy customers are more likely to return for future services, enhancing loyalty to the dealership.
Leveraging this technology ensures better customer experiences and builds stronger relationships with clients.
Key Features of Digital Fixed Ops Leaderboard

The Digital Fixed Ops Leaderboard has many features that improve service operations. It includes performance rankings and key service metrics to boost teamwork and competitiveness.
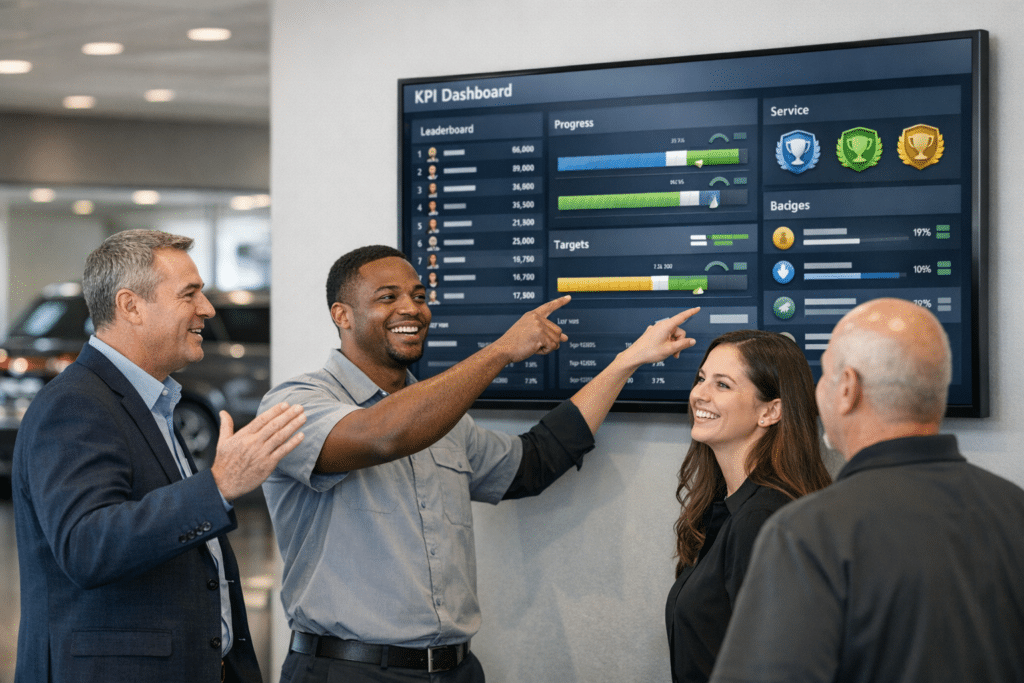
Performance rankings
Performance rankings show how well technicians perform. The Digital Fixed Ops Leaderboard uses real-time DMS data to measure this. It tracks service orders and average completion times.
This helps dealers see who is excelling in their roles. By ranking technicians based on service metrics, they can identify top performers and those needing help.
These rankings drive competition among team members. They encourage everyone to improve their skills and efficiency. Forward-thinking dealers have seen fixed operations profit increase by 28% within just 12 months of using these tools.
Also, technician efficiency rose by 42%. Using performance rankings can lead to better outcomes for the whole service department.
Service metrics
Service metrics are crucial for tracking technician performance. They help in optimizing service operations and improving efficiency.
- Fixed Ops Leaderboards rank dealers based on service metrics. This ranking offers a clear view of how well each dealer performs compared to others.
- These leaderboards measure technician performance using real-time DMS data. Technicians can see their work and understand where improvements can be made.
- Average completion times for service orders are tracked closely. This helps in streamlining service operations, reducing delays, and improving customer satisfaction.
- The leaderboard provides valuable insights into labor utilization strategies. Dealers can identify how technicians are using their time and make changes to boost productivity.
- Tracking CSI performance is essential for keeping customers happy. Digital tracking technology allows dealerships to see how well they serve clients, leading to better retention rates.
- Forward-thinking dealers saw fixed operations profit increase by 28% within 12 months after using these tools. The increase in profits shows the effectiveness of implementing digital efficiency measures.
- Enhanced decision-making comes from accessing detailed performance metrics easily. Managers can quickly act on trends, which leads to improved service management and outcomes.
- Car dealerships benefit from improved competitiveness through these metrics. Teams with higher rankings often feel motivated to perform better, fostering teamwork in the workplace.
- AI-powered scheduling tools further optimize technician hours based on these metrics. This ensures that staff is available when needed, reducing wasted time and increasing overall efficiency.
- Overall, leveraging service metrics significantly contributes to gross profit growth in the automotive industry.
Competitiveness and teamwork
Competitiveness and teamwork are vital in the Digital Fixed Ops Leaderboard. The leaderboard ranks technicians based on their performance metrics. This ranking fosters a spirit of competition among team members.
Technicians strive to improve their scores, which boosts overall productivity.
Teamwork thrives as employees work together to enhance service operations. They share tips and support each other in meeting goals. Forward-thinking dealers saw fixed operations profit grow by 28% after using these tools.
Technician efficiency also rose by 42%. This collaboration leads to improved customer satisfaction and retention through better service management.
Implementing the Leaderboard in Your Service Department

Implementing the Leaderboard in your service department can boost performance and teamwork. It helps you track progress and improve service quality. Curious to learn more?
Success stories and case studies
Success stories show how the Digital Fixed Ops Leaderboard improves service departments. Many dealerships have seen great results.
- A car dealership increased profits by 28% after using the leaderboard tools. This change happened within just 12 months. The dealership focused on optimizing technician hours and improving service management.
- Another dealer saw technician efficiency rise by 42%. They used real-time data to track service orders and completion times. Staff worked better together, leading to happier customers.
- One service department reported a boost in customer satisfaction scores. They ranked their performance using the leaderboard’s metrics. This ranking helped them set clear goals for improvement.
- A fixed ops team began using digital tracking technology to manage workflows. The insights they gained led to smarter scheduling and fewer wasted hours.
- A group of forward-thinking dealerships implemented expert strategies for meetings in fixed operations. These strategies streamlined their processes from preparation to follow-up, saving time and resources.
- Case studies showed that measuring technician performance with DMS data was key. Dealerships learned what areas needed attention and improved overall productivity quickly.
- Automotive leaders compared their efforts based on service metrics through the leaderboard. This comparison enabled them to spot trends and adjust strategies effectively.
- Several dealerships shared positive feedback about collaboration among staff members improved significantly due to healthier competition fostered by the rankings.
- Teams developed strong relationships as they aimed for higher rankings on the leaderboard, boosting morale while enhancing customer service interactions.
- Using the Digital Fixed Ops Leaderboard became a practical approach for many dealers aiming for growth in gross profit within their automotive service operations.
Future trends and innovations
The Digital Fixed Ops Leaderboard will continue to evolve. Dealers can expect more AI-powered scheduling tools. These tools help optimize technician hours and improve service department management.
Forward-thinking dealers have seen fixed operations profit rise by 28%. Technician efficiency increased by 42% in just one year after using these new technologies. New trends also focus on real-time data analysis, which boosts decision-making.
Enhanced customer satisfaction will drive loyalty and retention in the automotive service industry.
Conclusion: Leveraging Digital Technology for Gross Profit Growth in the Automotive Service Industry

Optimizing technician hours boosts your service department. Using the Digital Fixed Ops Leaderboard helps track performance in real-time. It makes decision-making easier and improves efficiency.
Happy customers are more likely to return, helping you grow profits.
Think about how this tool can change your operations. Will you take action to implement these ideas? Many dealers have seen big gains in profits after using it.
For more insights, explore resources on digital service tools. Remember, every small change can lead to success. Start today and watch your team thrive!
FAQs
1. What is the Digital Fixed Ops Leaderboard?
The Digital Fixed Ops Leaderboard is a tool that ranks dealers based on service metrics, which aids in optimizing technician hours and helps in developing CSI performance.
2. How can I optimize technician hours using this leaderboard?
The leaderboard uses AI-powered scheduling to assist you in optimizing your technicians’ time efficiently, resulting in better customer service.
3. How does ranking dealers based on service metrics help my business?
Ranking dealers by their service metrics allows you to identify top performers and areas for improvement, leading to optimized operations and improved CSI performance.
4. Can the Digital Fixed Ops Leaderboard improve my dealership’s Customer Satisfaction Index (CSI) score?
Yes! By leveraging this leaderboard’s data, you can make informed decisions about scheduling and service optimization that directly contribute to enhancing your CSI score.