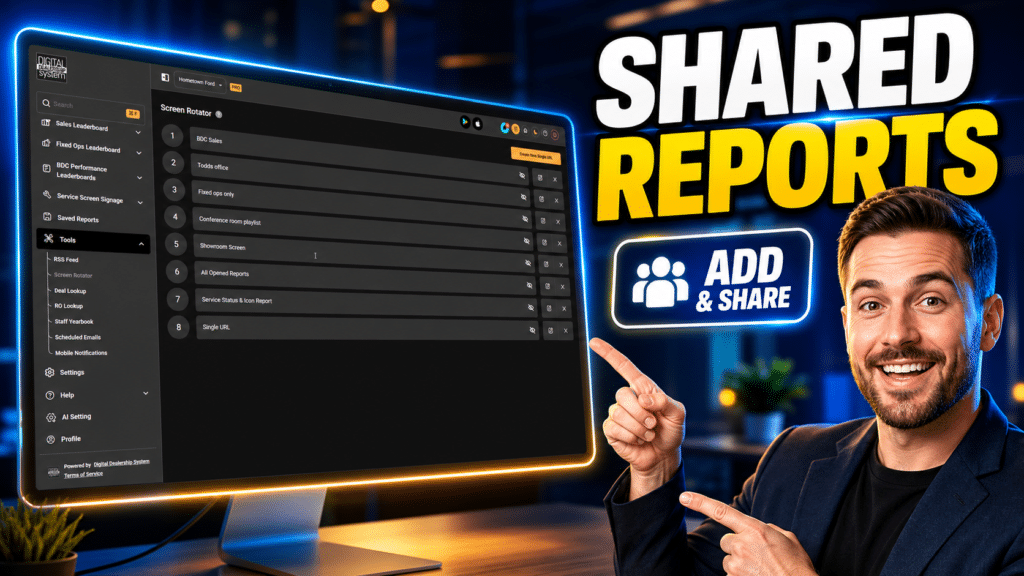

Ever stare at your service department’s monthly numbers and wonder where all that money actually went?
You know cash is coming in. But if you can’t see exactly where it starts and where it leaks out, you’re basically guessing.
Here’s a number that should grab your attention: over $156 billion flowed through service and parts departments at franchised dealerships in 2024 alone.
That’s either a goldmine or a hole in your bottom line, depending on how closely you’re watching the numbers on your dashboards.
I’m going to walk you through the exact fixed ops metrics that show what’s really happening across service, parts, and technician performance. Grab your coffee, and let’s get into the numbers that actually move your dealership’s profitability.
Key Takeaways
- Service departments generated over $156 billion in 2024, which makes tracking fixed ops metrics essential for protecting your dealership’s profit.
- Effective labor rate, hours sold per repair order, and gross profit percentage are the core numbers you need to watch across every department.
- First-time fix rates and customer satisfaction scores drive retention directly, and 45% of vehicle owners say they’re unhappy with their service experience right now.
- Digital vehicle inspections and clear communication boost repair approvals and strengthen your online reputation at the same time.
- Smart parts inventory management, using tools like RFID tagging and data analytics, stops stockouts and keeps your technicians working instead of waiting around.
Essential Fixed Ops Metrics for Dealerships
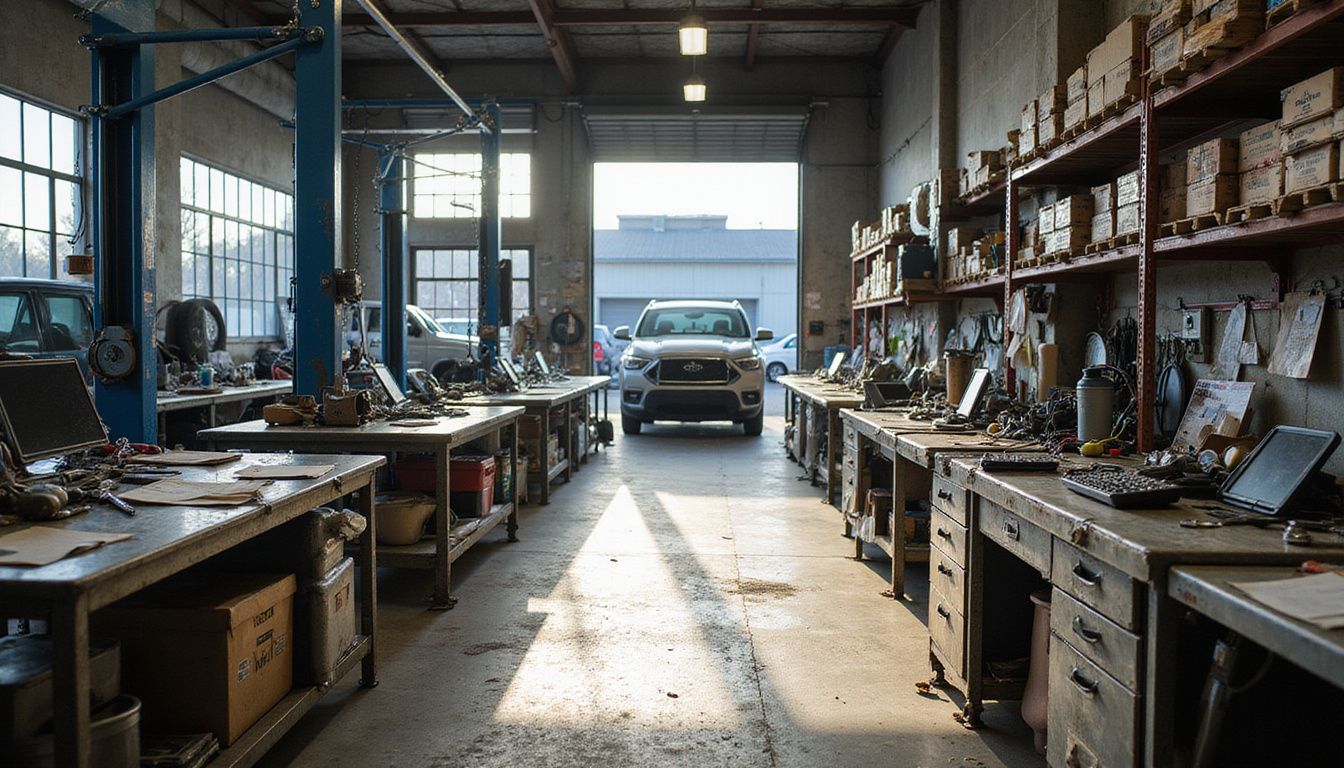
Your fixed ops metrics are the backbone of dealership profitability. Tracking them across departments gives you real visibility into what’s actually working.
Your service team, parts counter, and technician crew all generate numbers that tell the true story of your business health. Put those numbers on a dashboard, and everyone on your team knows exactly what “good” looks like.
What is an Effective Labor Rate and Why Does It Matter?
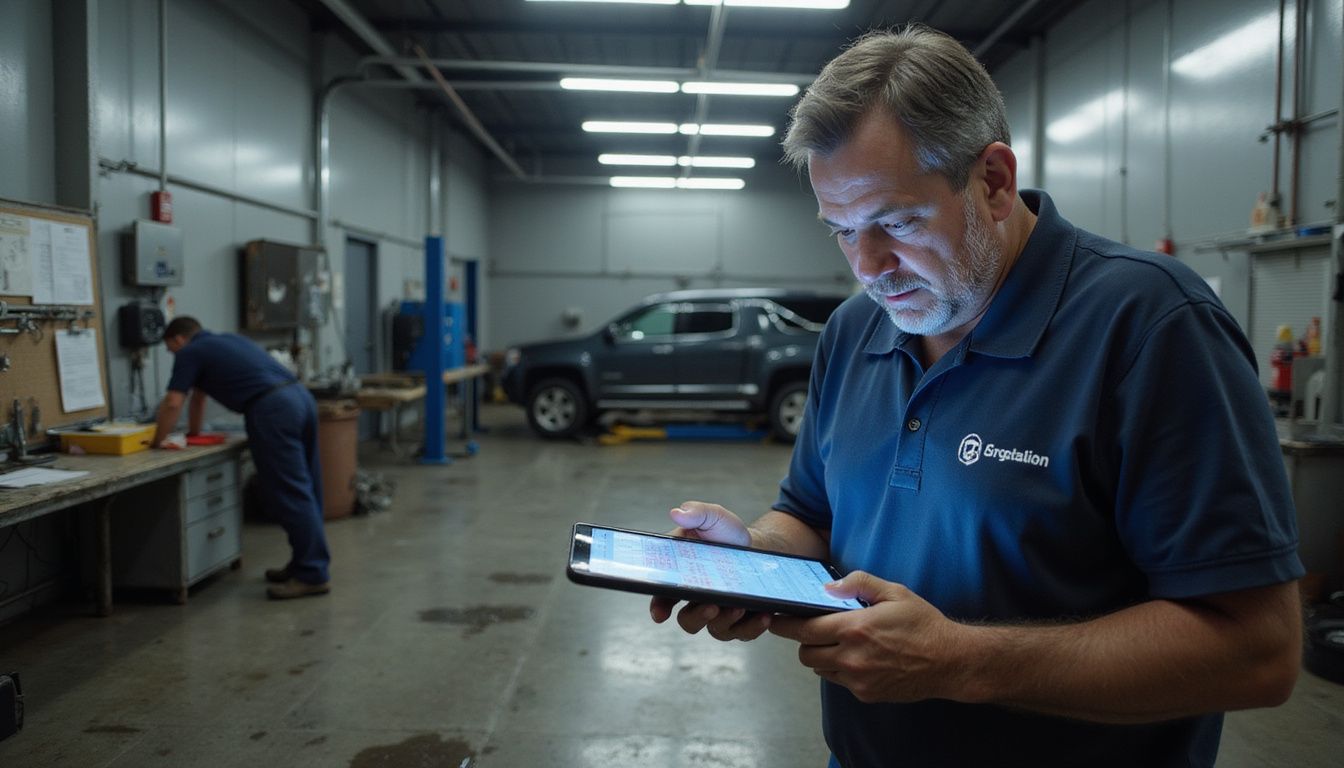
Your service department earns revenue every time a technician finishes a job. The effective labor rate measures exactly how much money your shop earns for each billed hour. You calculate it by dividing total labor sales by total labor hours billed.
This simple formula shows whether your technicians work at profitable rates, or whether small discounts are quietly eating into your margins.
Picture a technician billing ten hours at a $120 effective labor rate. That brings in $1,200 in labor revenue. Now picture that same technician billing the same hours at $110 instead, which only brings in $1,100.
Over a month with dozens of repair orders moving through your bays, those small gaps add up fast. According to 2026 dealer optimization research by McKinsey, raising your effective labor rate by just $10 an hour can add more than $50,000 to your annual gross profit, without selling a single extra hour of labor.
Small discounts feel harmless until they destroy your entire margin strategy.
Minor operational leaks damage your bottom line more than most dealership leaders realize. A $5 discount here, a courtesy adjustment there, and your effective labor rate starts drifting downward before you even notice.
Smart shops review the rate by pay type, splitting customer pay work from warranty and internal jobs. Each category tells a different story about your service profitability.
Large groups like Penske Automotive Group and Lithia Motors track these numbers monthly to keep revenue steady. When executives spot a declining rate, they ask a few quick questions:
- Are technicians underpricing complex jobs to move faster?
- Does the service absorption rate need a closer look?
- Are courtesy discounts happening too often at write-up?
Either way, the goal stays simple: keep labor rates steady, and watch dealership profitability climb.
How Can Hours Sold Per Repair Order Improve Service Efficiency?

Your service team captures more revenue when technicians maximize hours sold per repair order. This metric shows how well your advisers capitalize on each vehicle visit, and industry benchmarks suggest aiming for 2.5 to 3.25 hours per repair order for strong productivity.
Service advisers should cut down on repair orders with just one item on them, and instead focus on smart upsells that raise the total invoice value.
Based on full-year 2025 data from the National Automobile Dealers Association, U.S. franchised dealers averaged roughly $494 per customer-pay repair order across more than 276 million repair orders written that year. Looking at around 100 repair orders per adviser each month gives you solid data to compare against that number. Here’s what that data helps you spot:
- Which advisers upsell well, and which ones need coaching
- How your average invoice compares to the $494 national benchmark
- Whether technician utilization is climbing along with hours per repair order
- Where your parts counter needs to speed up to keep pace with busier repair orders
Service order efficiency improves once advisers know which services customers typically need at each visit, which keeps technicians working on more tasks per appointment instead of sitting idle.
Your gross profit percentage climbs as hours sold per repair order increases, which strengthens your cash flow and creates a direct link between this metric and your bottom line.
What Does Gross Profit Percentage Reveal About Performance?

Your gross profit percentage works like a financial mirror for your service department. It shows exactly how much money stays in your pocket after you pay your technicians.
Calculate it by subtracting technician pay from labor revenue, then dividing that number by total revenue. For example, if a job earns $200 and technician pay is $60, your gross profit is $140, or a 70% gross profit percentage.
That single number reveals whether your service operations run efficiently, or whether margin erosion is quietly eating into your results. Here’s how the key benchmarks stack up right now:
| Benchmark | Where You Stand |
|---|---|
| 76% gross profit percentage | Healthy target for a well-run service department |
| $218 average gross profit per RO | Up 5% year-over-year as of 2025 |
| 50% of dealership gross profit | Comes from fixed ops, despite just 10% to 15% of total sales, according to recent NADA dealership financial data |
| 100%+ service absorption | NADA’s target, meaning fixed ops covers all dealership overhead |
| 64% national average absorption | Where most U.S. dealerships actually stand in late 2025 |
That gap between 64% and 100% shows how much room most dealerships have before fixed ops truly covers its own weight. Your gross profit percentage exposes those problems fast: it signals whether your labor rate discipline needs tightening, or whether internal processes are wasting time and resources.
Strong gross profit percentages connect directly to effective labor rate management and streamlined workflows, and when the number drops below target, something in your service revenue or technician pay structure needs adjustment.
Your KPI dashboard, powered by business intelligence tools and your DMS system, should track this number constantly. Watching it closely helps you catch issues early, before they turn into serious financial problems.
Measuring Customer Satisfaction and Retention
Your customers vote with their wallets. The customer satisfaction index tells you exactly how happy they are with your service department.
Tracking retention rates and warranty claim rates gives you the real story. Does your team keep customers coming back, or send them down the street to a competitor?
According to the 2026 J.D. Power U.S. Customer Service Index Study, a standard maintenance visit at a mass-market dealership takes about 1.61 hours on average. That’s roughly three times longer than the under-an-hour visit customers get at most aftermarket shops, so if your bays feel slow, customers have faster options waiting nearby.
How is the Customer Satisfaction Index (CSI) Calculated?
Understanding how CSI works gives you real power over your service department’s reputation and bottom line.
| CSI Component | What It Measures | How It Impacts Your Dealership |
|---|---|---|
| Quality of Work | Did technicians fix the problem correctly on the first attempt? Were repairs completed to manufacturer standards? | High quality scores build trust. Customers return for future service. Your online reputation strengthens. |
| Speed of Service | How quickly did service advisors complete the job? Did you meet promised completion times? | Fast turnaround times reduce customer frustration. People appreciate getting their vehicles back promptly. Service retention increases. |
| Communication Transparency | Did you explain costs upfront? Were customers informed about repair progress? Did advisors answer questions clearly? | Clear communication prevents shock at the bill. Customers feel respected and informed. Trust grows stronger. Approval rates for repairs climb. |
| Automated Survey Data | What feedback do customers provide immediately after service completion? | Real-time responses reveal problems fast. Issues get fixed before they damage your reputation. Quick action improves scores. |
| Digital Vehicle Inspections (DVI) | Did technicians use photos and videos to show customers what repairs are needed? | DVIs boost repair approval rates significantly. Customers see exactly what’s wrong. Transparency increases satisfaction. CSI scores rise noticeably. |
| Online Scheduling Integration | Can customers book appointments easily through digital channels? | Convenient scheduling reduces friction. Customers feel valued when booking is simple. Satisfaction improves. |
A controlled rollout across eight locations tested how displaying CSI and first-time fix rate metrics on lobby and bay screens would affect performance. Over 90 days, the pilot locations showed these numbers on digital signage during business hours.
Daily visibility led to a 7% lift in automated survey completion and a 4 point increase in average CSI, compared to locations that didn’t display any KPIs. When technicians and advisers could see CSI and FTFR live, shop conversations shifted from tasks to targets, and guests responded to post-service surveys more often.
This simple transparency move drove real improvement without adding complexity to anyone’s daily workflow. Here’s why CSI matters so much for your dealership:
- It’s a leading indicator of customer retention. When scores climb, customers come back and tell friends, which shows up in your online reviews.
- Forty-five percent of vehicle owners say they’re unhappy with their dealership service experience, usually because of surprise costs or poor communication. That’s a fixable problem sitting right in front of you.
- Automated surveys sent right after service capture honest feedback while it’s fresh, so advisers can address concerns the same day.
- Digital vehicle inspections build trust fast. Photos and videos show customers exactly what technicians found, which boosts both repair approvals and CSI scores.
- Online scheduling removes friction before customers even arrive, and quality of work plus fast turnaround times keep them loyal long after.
What Are Effective Ways to Track Retention Rates?

Your dealership’s retention rates reflect customer loyalty, and they hit your bottom line directly. Tracking these numbers gives you the data you need to keep customers coming back instead of drifting to an independent shop.
Numbers to watch first:
- Service visit frequency dropped to 30% recently, down from 35% in 2021. According to a 2025 fixed operations study by Cox Automotive, only 54% of customers with vehicles two years old or newer returned to their selling dealership for service in 2025, down sharply from 72% just two years before. That’s a fast slide, and it means passive retention isn’t working anymore.
- Service revenue per repair order: divide total service revenue by the number of repair orders in a given period to see your average spend per visit and guide your marketing dollars.
- Repeat customers within 12 months: your average customer retention rate sits at 34%, so track how many customers beat that number and reward the teams that do.
- Service-to-sales link: customers who use your dealership’s service department are 74% more likely to buy their next vehicle from you, compared to just 35% for customers who skip your service shop.
Systems that keep those numbers moving the right way:
- Put digital signage in your service area showing retention goals and current performance, so staff see the numbers daily and stay accountable.
- Offer online scheduling and texting for appointments. Customers who can book 24/7 show higher retention because you’ve removed the friction.
- Build retention reports segmented by service type, so your multi-rooftop reporting shows which categories drive repeat visits across your auto group.
- Compare retention across your collision shop and service department separately, since different departments attract different customer habits.
How Does Warranty Claim Rate Impact Customer Loyalty?
Your service department’s warranty claim rate shapes how customers feel about coming back to your dealership. This metric tracks how often repairs fail or parts break under warranty, calculated by dividing the number of claims by total units sold or services completed.
Lower warranty claim rates mean higher quality work and stronger customer loyalty. High rates do the opposite: they damage trust and hurt future business.
Monitoring warranty claims lets you catch quality issues before they spiral. Recurring part defects get flagged and fixed before they turn into bigger, more expensive problems.
Cox Automotive research shows that customers hold onto bad experiences far longer than good ones, which makes warranty performance critical to your bottom line.
- A rising warranty claim rate often points to a training gap on the shop floor, not just bad luck with parts.
- Consistent improvement builds a reputation as a trusted name in your market.
- Fewer warranty issues mean lower customer acquisition costs, since negative word-of-mouth drops off.
- Tracking this KPI shows exactly how your technician efficiency and service quality stack up against the competition.
Tools like Targit Decision Suite or your inventory reporting system help you spot patterns in warranty data early, so you can fix quality trends fast before they hurt your reputation.
Monitoring Technician Performance

Your technicians drive fixed ops success. Tracking their performance metrics gives you the real picture of what’s happening on the service line, not just what you hope is happening.
What Is the First-Time Fix Rate (FTFR) and How Is It Measured?
First-Time Fix Rate measures the percentage of vehicles your technicians repair correctly on the first attempt. It’s one of the clearest signals of operational efficiency and customer trust in your service department.
| Metric Component | Details & Application |
|---|---|
| Definition of FTFR | FTFR tracks the percentage of repair jobs completed successfully without requiring a second visit or rework. It reflects how well technicians diagnose and fix problems on the initial service appointment. |
| Calculation Formula | Divide successful first-time repairs by total jobs completed. For example, if 95 vehicles out of 100 were fixed right the first time, that equals a 95 percent FTFR. This straightforward math helps you spot performance trends instantly. |
| Why FTFR Matters | High FTFR reduces operational costs by eliminating waste on repeat visits. The 2025 J.D. Power CSI Study revealed that 12% of repairs at U.S. dealerships are not completed correctly on the first visit, and closing that gap even slightly saves real time and money. Customers experience fewer frustrations, technician morale improves, and your dealership builds a reputation for reliability. |
| Impact on Customer Experience | Customers appreciate getting their vehicles back fixed right away. They skip unnecessary return trips to the service department. Positive customer experiences translate into loyalty, and word-of-mouth recommendations increase service volume naturally. |
| Measuring FTFR Monthly | Track FTFR consistently each month to spot trends and problem areas. Monthly reviews reveal which technicians excel and which need additional training. Digital signage displays can showcase departmental progress toward FTFR goals, motivating teams to perform better. |
| Improving FTFR Performance | Advanced diagnostic tools catch problems accurately on the first inspection. Parts availability directly supports higher FTFR numbers; missing components force technicians to schedule follow-up appointments. Invest in training programs that teach proper diagnostic procedures and stock inventory strategically. |
| Connection to Operational Efficiency | FTFR serves as a leading indicator of how smoothly fixed operations run. Reduced rework hours mean technicians spend more time earning revenue. Service capacity increases without adding staff or equipment. |
| Relationship to Customer Retention | Repeat visits from incomplete repairs frustrate customers and damage loyalty. High FTFR keeps customers coming back voluntarily for future maintenance, and retention rates climb as FTFR improves. |
| Digital Signage Integration | Display real-time FTFR metrics on screens throughout the service facility. Technicians see live performance data and stay motivated, while managers monitor progress without manual reporting. |
Monthly analysis across 12 dealerships tracked digital vehicle inspection usage and FTFR outcomes, and found a clear connection between the two. Sites with DVI completion rates above 80% reported a median FTFR of 92%, while sites below 40% DVI completion had a median FTFR of only 84%.
The visual evidence digital vehicle inspections provide supports better diagnosis and leads to more first-time fixes. That gives your service team a practical, low-cost tool for improving one of your most important performance metrics.
How Can Technician Productivity Be Increased?

While FTFR measures quality, technician productivity directly impacts your service department’s profitability and revenue generation. Boosting productivity means your technicians work smarter, not just harder, and your dealership sees real financial gains.
Tighten your scheduling and workflow:
- Set up better scheduling systems that cut idle time between appointments and keep technicians engaged all day.
- Streamline appointment flow so technicians move from one repair order to the next without delays.
- Apply process standardization across your service bays so billed hours keep climbing steadily.
Invest in people, not just process:
- Offer ongoing technician training that sharpens skills and cuts rework, which raises your first-time fix rate right alongside productivity.
- Monitor and coach your team regularly, giving feedback that keeps technicians motivated and moving toward their goals.
Let your tools do the heavy lifting:
- Use your DMS system to set productivity benchmarks, then track actual performance against those targets.
- Calculate technician productivity by dividing billed hours by total hours worked, and share the results openly with your staff.
- Deploy digital tools that automate paperwork, freeing technicians to focus on actual repair work.
- Set clear productivity goals tied to your variable operations strategy and overall financial targets.
- Track total direct internal costs against billed hours to spot which technicians need extra support.
What Metrics Define Technician Efficiency?
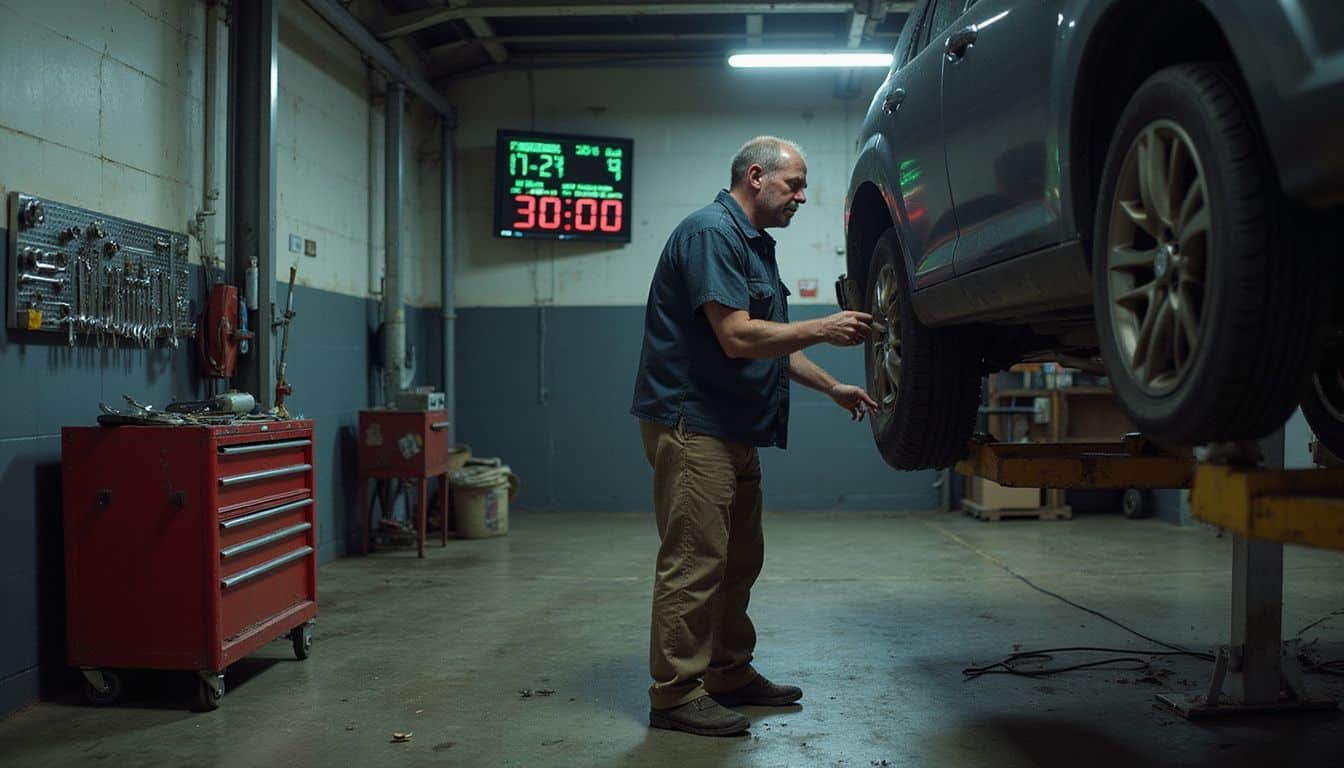
You’ve built a stronger team by boosting productivity. But here’s the real test: are your technicians working at peak efficiency? Productivity and efficiency aren’t the same thing, and that’s exactly where your digital signage strategy earns its keep.
| Metric | Definition & Calculation | Why It Matters for Your Shop | How Digital Signage Supports Tracking |
|---|---|---|---|
| Technician Efficiency Rate | Divide standard labor hours by actual hours worked. A technician assigned 40 standard hours who completes work in 35 actual hours shows 114% efficiency. | Reveals whether technicians complete tasks faster than allocated time. Identifies high performers and training gaps. Enables your shop to serve more customers daily without sacrificing quality. | Display real-time efficiency percentages on service department screens. Track daily, weekly, and monthly trends. Highlight top performers to motivate the team. |
| Task Speed vs. Allocated Time | Compare how long a technician takes to complete a specific repair against the manufacturer’s recommended time. Oil changes, brake jobs, and diagnostics all have industry benchmarks. | Shows whether processes move quickly or drag. Pinpoints where unnecessary steps slow operations. Distinguishes efficiency from raw output numbers. | Post comparison charts showing actual versus expected times. Use color coding to flag jobs exceeding benchmarks. Alert supervisors to workflow bottlenecks immediately. |
| First-Time Fix Rate (FTFR) | Measure the percentage of repairs completed correctly on the first attempt, with no comebacks required. Track rework instances monthly. | Efficient technicians fix problems right the first time. Rework destroys efficiency and customer satisfaction. Higher FTFR means faster throughput and lower costs. | Display FTFR percentages by technician or bay. Set team targets and celebrate milestones. Share data during daily huddles using your signage network. |
| Labor Utilization Rate | Calculate billable hours divided by total available hours. If a technician has 40 hours available and bills 36, utilization is 90%. | Reveals how much time technicians spend on paid work versus downtime. Efficient shops keep technicians busy without overwhelming them. Waste time, waste money. | Show hourly utilization rates on department dashboards. Alert management when utilization drops below targets. Schedule preventive maintenance or training during gaps. |
| Cycle Time per Repair Order | Measure average time from job start to completion. Include prep, diagnostics, repairs, and quality checks. Track by service type. | Fast cycle times mean cars get fixed quickly and customers stay happy. Efficiency improvements reduce bottlenecks. Shorter times free up bays for more vehicles. | Post average cycle times on service boards. Compare current performance to previous months. Highlight jobs completed ahead of schedule. |
| Digital Vehicle Inspection (DVI) Completion Rate | Track percentage of vehicles receiving digital inspections without manual re-entry or duplicate data collection. | DVI eliminates double data entry and breaks information silos between departments. Technicians spend less time on paperwork, more time fixing cars. Efficiency jumps instantly. | Display DVI completion percentages live. Recognize technicians who consistently complete inspections. Link DVI rates to customer approval rates to show value. |
Optimizing Parts and Inventory Management

Your parts inventory can make or break your service department’s reputation. Smart inventory management keeps customers happy, technicians working, and your gross return on investment climbing.
How to Improve Parts Availability Rate?

Your dealership’s parts availability rate directly affects repair speed and customer satisfaction. Divide the number of times a part is in stock by total requests, and you get a clear picture of your service efficiency.
- Install lot sensors and RFID tagging across your parts inventory to track stock levels in real time, cutting invoicing delays and speeding up repair orders.
- Build strong supplier relationships that allow quick restocking when demand spikes, so your parts availability rate keeps climbing instead of dropping.
- Use digital inventory tools to cut workflow delays, giving technicians instant access to parts information and shorter cycle times per repair order.
- Forecast parts demand by studying historical repair data, seasonal trends, and the vehicle models common in your used-vehicle departments.
- Check parts availability metrics weekly on your dashboard, and adjust your order planning around peak service periods to avoid stockouts.
- Track which parts move fastest and slowest, then adjust inventory levels to free up capital while keeping common repair parts on hand.
A medium sized parts warehouse installed RFID tagging and lot sensors to cut search time and invoicing delays. Within 60 days, stockouts on part requests dropped from 11% to just 3%, and average parts pick time fell from 6.8 minutes to 2.4 minutes per request.
RFID removed the guesswork at the parts counter and kept technicians on task instead of standing around waiting. That’s the kind of technology investment that pays off in both parts availability and technician productivity across your fixed operations.
What Are Best Practices for Strategic Inventory Management?

Improving parts availability gets you halfway there. Strategic inventory management takes you the rest of the way, and digital inventory systems paired with data analytics form the backbone of smart parts forecasting.
- Deploy lot sensors and RFID tagging to track parts in real time, so you always know what’s on your shelves.
- Build strong supplier relationships, because quick restocking keeps technicians moving and customers happy.
- Run regular inventory audits to catch problems before they spiral out of control.
- Integrate everything with your DMS system for a seamless flow of information across departments.
- Use data-driven forecasting to cut excess inventory that ties up cash, while improving parts turnover dealership-wide.
A mini audit compared 30 repair orders to check invoicing accuracy between manual parts entry and integrated DMS feeds. Manual entry cases showed a 12% invoicing delay rate and a 6% mismatched part code rate, while integrated DMS cases showed just a 2% delay rate and a 1% code mismatch rate over the same sample. That comparison makes it obvious: integration cuts administrative errors and speeds up invoicing.
Multi-rooftop operations need centralized reporting pulling from every location’s inventory feed, and digital inventory systems make that reporting accurate without slow manual work getting in the way.
Modern inventory management helps you respond faster to market changes, stay competitive in automotive retail, and improve your inventory turn rate. You’ll free up floor space tied up in excess stock and get one dashboard showing the complete picture across every rooftop you manage.
Conclusion
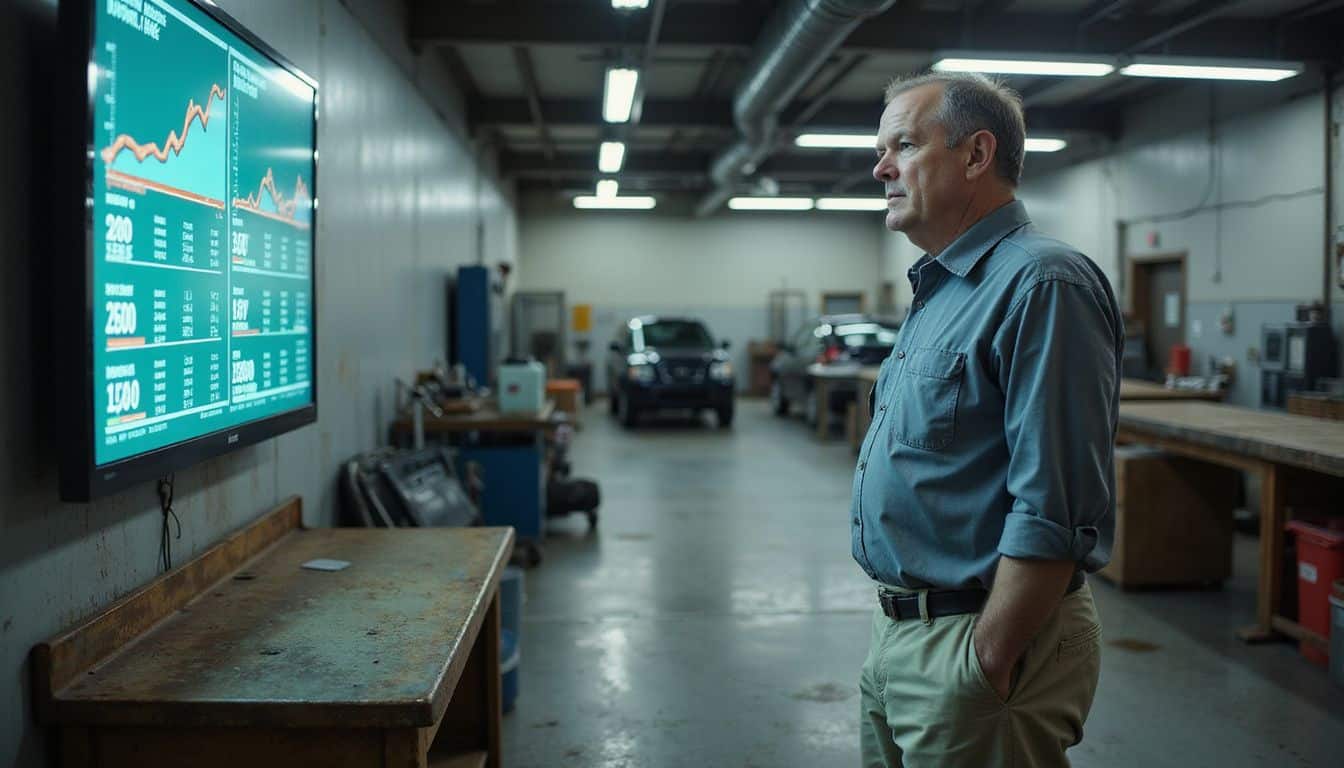
Your fixed ops metrics tell the real story of your dealership’s health.
When you track labor rates, hours per repair order, and gross profit percentage across service and parts, you take control of the departments that generated over $156 billion in revenue last year.
Digital signage puts these KPIs in front of your team in real time, keeping everyone focused on what actually matters.
Start measuring first-time fix rates and customer satisfaction scores today. Then watch your service absorption climb toward that 100% NADA benchmark, one tracked number at a time.
The data is already there. Now it’s time to put it to work.
FAQs
1. Why should dealership executives track fixed ops metrics across departments?
Fixed ops generates about 49% of a dealership’s total gross profit according to recent NADA data, so tracking these numbers across service, parts, and reconditioning helps you catch profit leaks early. Group 1 Automotive, Lithia Motors Inc., and AutoNation Inc. all use real-time dashboards to keep tabs on these metrics dealership-wide.
2. What KPIs matter most for fixed ops performance?
Inventory turn rate, appraisal-to-trade ratio, and used-to-new ratio give you the clearest picture of how efficiently your team is moving metal and managing reconditioning. Cost to market and fixed coverage show whether your service department is pulling its weight to cover overhead when new-vehicle margins get squeezed.
3. How does digital marketing connect to fixed ops success?
Digital marketing brings local customers straight to your service bays, and a 2025 Cox Automotive study found that dealerships using targeted service campaigns saw a 23% increase in appointment bookings. A strong BDC keeps those leads from going cold by following up fast and filling your schedule.
4. What role do reports like the Used Car Market Report and Outlook play?
These reports from Cox Automotive and Edmunds help you price cars right and understand what shoppers are actually willing to pay in your market. Groups like Presidio-NCM use this data to set smarter packs and adjust pricing strategy week by week.
5. How does M&A activity affect fixed ops metrics?
When auto groups merge or buy new stores, your appraisal ratios and inventory turn rates can swing fast as systems and processes get integrated. You need to watch those numbers closely during the first 90 days to make sure performance stays on track.