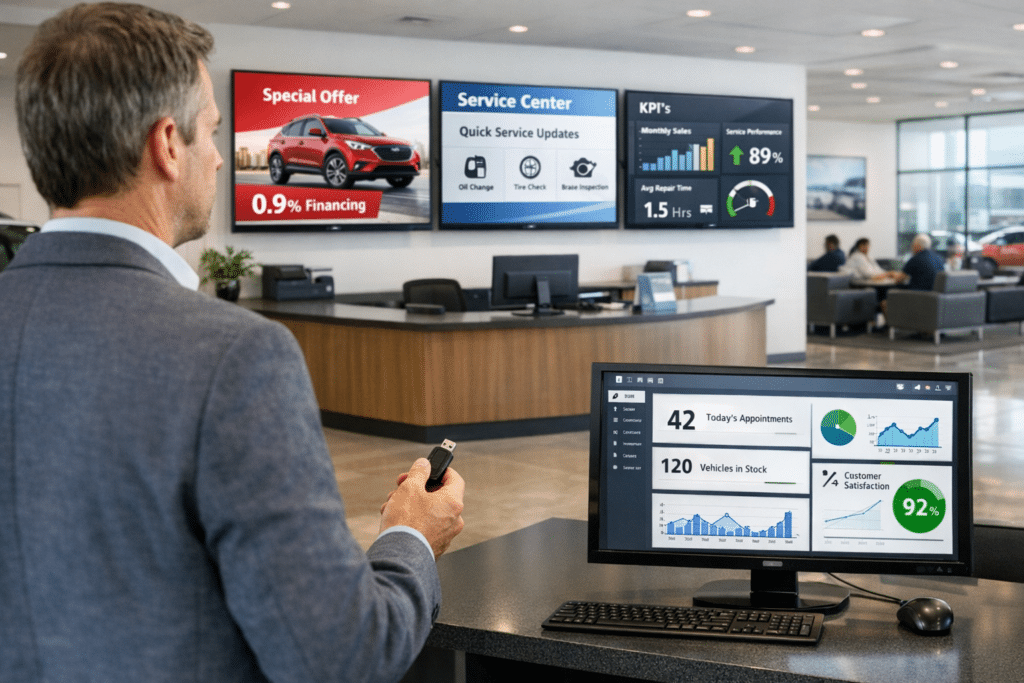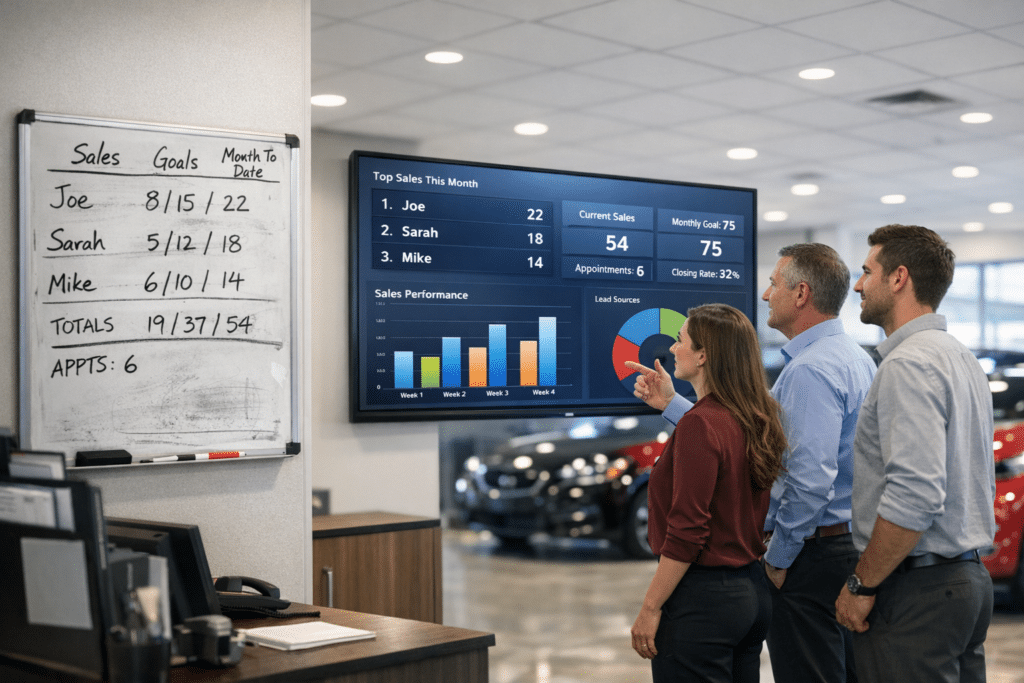
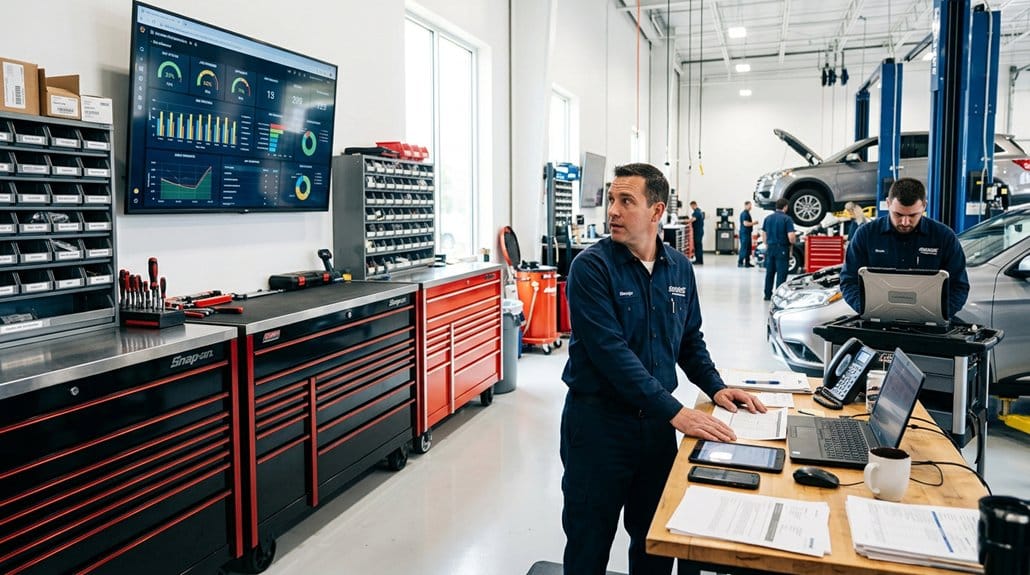
You’re wasting valuable labor hours and missing profit by manually updating fixed‑ops reports. Automated dashboards give real‑time visibility into service revenue, technician efficiency, parts fill rates and customer‑pay gross so you can act fast. Manual processes cause inconsistent data, delayed insights and revenue leakage while tying up ~20 hours/week that could go to coaching and throughput. Implementing BI with cleansed DMS feeds and alerts cuts reporting time ~75% and boosts accuracy ~25%, and below you’ll find how to start.
Key Takeaways
- Manual reporting consumes ~20 hours/week, diverting managers from coaching, throughput, and customer experience improvements.
- Inconsistent data structures cause inaccuracies, misrepresenting KPIs like gross profit per vehicle and technician efficiency.
- Delayed, error-prone reports prevent timely responses to trends, allowing revenue leakage and missed corrective actions.
- Automated BI dashboards provide real-time KPIs (ELR, HPRO, efficiency) for faster, targeted operational decisions.
- BI reduces reporting time ~75%, increases data accuracy ~25%, and enables measurable ROI through reclaimed labor and revenue gains.
What to Automate First: Five Fixed‑Ops Reports to Set Up Now
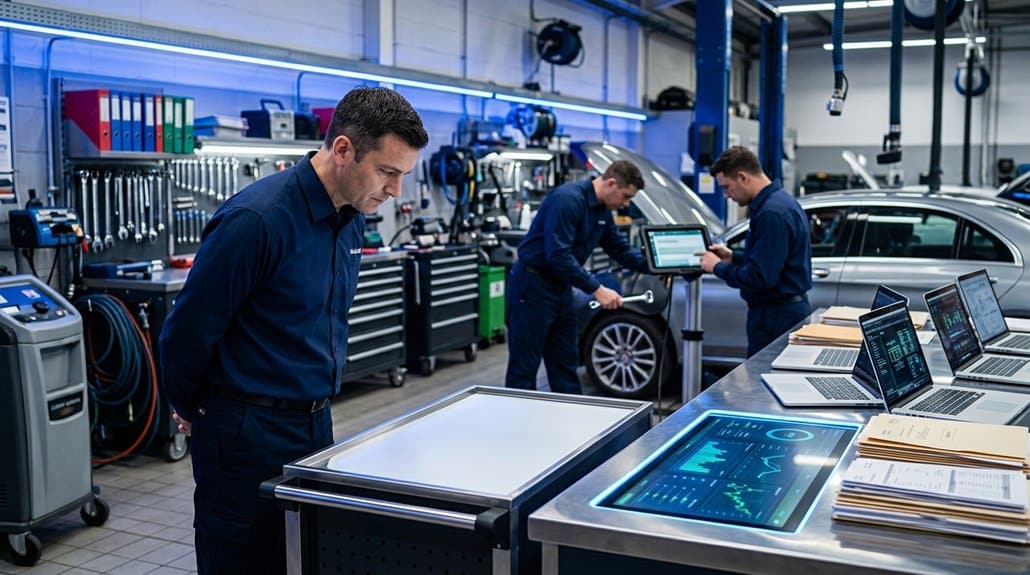
Start with the five reports that deliver the fastest, measurable impact: automating service revenue, technician efficiency, parts inventory, customer‑pay gross profit, and appointment/recall management gives you real‑time visibility into profitability, productivity, stock health, margin per RO, and service lane demand. You’ll use report prioritization strategies to sequence deployment: start with service revenue and customer‑pay gross profit for margin control, add technician efficiency to boost throughput, then parts inventory to sustain a 90% first‑time fill rate, and finish with appointment/recall to monetize demand. Implement an automation tools overview that maps sources, cadence, and KPIs; set alerts for variance thresholds and integrate dashboards into daily huddles. This process reduces lag, exposes trends, and drives measurable operational gains.
How Manual Fixed‑Ops Reporting Wastes Time and Hides Losses
You’ve just prioritized the five reports that will move the needle; now consider what happens when those reports are built by hand. You spend hours aggregating disparate DMS extracts, which creates time inefficiency that pulls you away from coaching techs and improving throughput. Inconsistent data structures breed data inaccuracies, so KPIs like gross profit per vehicle fluctuate without a real cause. Delayed, error-prone reports mean you react to trends days or weeks late, missing chances to fix labor mix, parts margins, or appointment conversion. Fragmented manual processes obscure root causes of loss and prevent timely corrective actions, so revenue leakage persists. Quantify time spent, map the manual steps, and measure lost margin tied to reporting delays to justify change.
How to Implement Automated Fixed‑Ops Reporting (Tools, Timeline, Roles)

Before you can reap the efficiency gains, map a clear, phased rollout that ties tools, timeline, and roles to measurable outcomes: Start with data cleansing (week 1–4) to guarantee accuracy, then select a BI solution such as TARGIT for robust data integration across DMSs. Phase two (weeks 5–8) deploy pre-built templates and configure customizable dashboards to standardize KPIs. Assign a BI champion and a data analyst to own implementation, validation, and cadence. Phase three (weeks 9–12) focus on training strategies, hands-on workshops, and documentation to drive adoption. Expect up to an 80% reduction in manual entry time, freeing you to act on insights. Maintain a recurring role-based audit to preserve data quality and ROI.
Metrics to Monitor and How Automated Reports Surface Problems Faster
When you tie real-time DMS feeds to standardized KPIs—like Effective Labor Rate (ELR), Hours per Repair Order (HPRO), technician efficiency, customer‑pay gross, and service absorption—you’ll spot deviations minutes instead of days, enabling targeted corrective action; for example, ELR dips or rising HPRO can trigger alerts to investigate understaffing, scheduling inefficiencies, or training gaps, while automated rollups across rooftops surface inconsistencies in technician productivity and gross that manual reports often miss. You’ll monitor key performance indicators continuously, using real time data to detect trends: ELR, HPRO, tech efficiency, customer‑pay gross, and service absorption (recently moved from 65.3% to 66.3%). Automated reports prioritize anomalies, assign owners, and track remediation, shortening detection-to-resolution cycles and improving operational outcomes.
Quick ROI Checklist: Costs, Savings, Next Steps
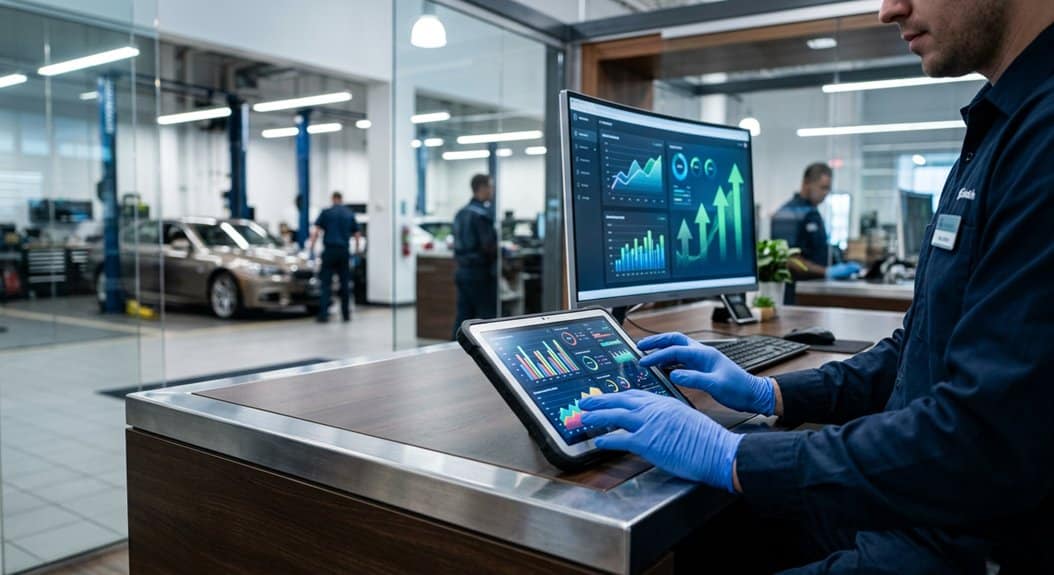
Having automated KPIs and real‑time alerts in place makes the next question practical: what will this change cost, what will it save, and how fast will you see payback. Start with a concise cost analysis: vendor fees, implementation, training, and integration—compare to current labor cost of up to 20 hours/week for manual reporting. Quantify savings potential: BI solutions can cut reporting time by ~75%, reduce labor expense and errors, and boost data accuracy by 25%. Create a 6–12 month ROI model that includes incremental service revenue from faster decisions and improved retention. Next steps: run a pilot, measure time reclaimed, error reduction, and revenue lift; iterate dashboard KPIs; scale once pilot meets projected payback threshold.
Frequently Asked Questions
What Is the $3000 Rule for Cars?
The $3000 rule says you should budget about $3,000 annually (or 3% of original price) for upkeep; it highlights $3000 significance in anticipating increasing vehicle depreciation, guiding a data-driven, process-oriented maintenance decision to minimize costs.
What Does a Fixed Operations Manager Do at a Dealership?
Like a ship’s navigator, you steer fixed operations, optimizing service efficiency, tracking KPIs, driving report automation, managing parts and techs, and improving customer satisfaction—using data-driven processes to boost throughput, retention, and dealership profitability.
What Should You Never Reveal to the Dealer When Negotiating?
You shouldn’t reveal your maximum budget, trade-in quotes, urgency, financing preference, or intent to shop — using negotiation tactics informed by dealer psychology lets you follow a data-driven, process-oriented approach that’s results-focused and preserves leverage.
How Much Commission Does a Car Salesman Make on a $30,000 Car?
Example: a rookie earns 25% of profit and nets $750 on a $30,000 car. You’ll see commissions vary by commission structures, sales incentives, flat fees, and bonuses—track processes, measure results, optimize for higher payouts.
Conclusion
You’re bleeding time and profit when you update fixed‑ops reports by hand; automating those five key reports stops the leaks. By shifting to scheduled data pulls, dashboard visualization, and role‑based alerts, you’ll cut hours, surface repeat issues faster, and measure technician, parts, and CSI trends reliably. Think of automation as a well‑oiled machine turning raw numbers into action. Start with tools, assign an owner, set a 30‑ to 60‑day rollout and track ROI weekly.