You can boost service revenue and productivity by deploying a DMS-connected fixed ops leaderboard that updates every 15 minutes and tracks ROs, ELR, technician efficiency, OP-code saturation, and CSI. Visible KPIs drive accountability, friendly competition, and targeted coaching while converting insights into measurable AROV and Customer Pay RO gains. Set clear targets, fair rewards, and automate corrective workflows to sustain performance. Keep going and you’ll uncover practical setup, integration, and ROI-validation steps to implement immediately.
Key Takeaways
- Display real-time KPIs (ROs, ELR, CSI, OP-Code saturation) on leaderboards to create transparency and urgency.
- Tie visible targets and fair rewards to measurable goals like Customer Pay RO count and AROV to drive behavior.
- Use 15-minute DMS updates and mobile/TV displays so advisors and technicians adjust tactics immediately.
- Combine leaderboard insights with focused coaching and root-cause analysis to remove bottlenecks and improve performance.
- Track before/after metrics to quantify ROI, celebrate wins publicly, and sustain motivation through recognition.
What a Fixed Ops Leaderboard Tracks and Why It Matters
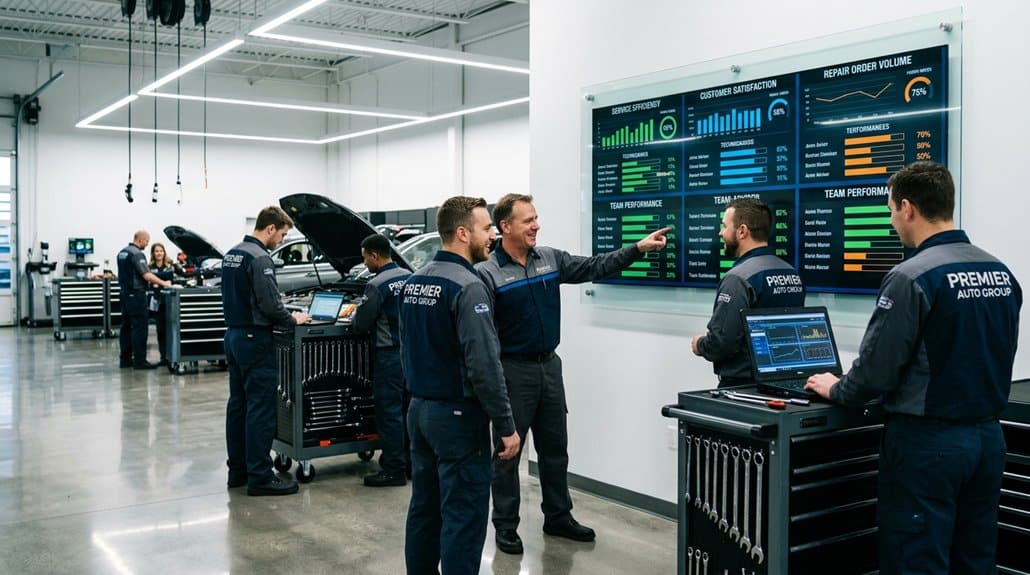
When you want measurable improvements in service performance, a Fixed Ops Leaderboard gives you real-time visibility into the KPIs that drive results—ROs, Effective Labor Rate (ELR), CSI, OP-Code Saturation, and Average Repair Order Value (AROV)—so managers and staff can act on accurate data. You’ll get DMS-connected reports updating every 15 minutes, so your team’s actions are based on current performance analytics. The dashboard highlights OP-Code Saturation and AROV to pinpoint revenue opportunities, while CSI tracks customer impact. Visible digital signage fuels leaderboard engagement, creating transparent accountability and friendly competition that raises throughput and morale. Use the data to set targets, track progress, and correct course quickly; that focus converts insights into measurable service-department gains.
Design KPIs for Your Fixed Ops Leaderboard (ROs, ELR, Efficiency, CSI)
You’ve seen how a real-time fixed ops leaderboard surfaces opportunities; now you need to pick the right KPIs that will drive measurable service outcomes. Focus on ROs as a primary revenue indicator—track counts and RO Strategies that link advisor behavior to retention and upsell. Surface ELR Insights to monitor billed hours and pricing adjustments that improve per-hour revenue. Include technician Efficiency Boosts by showing throughput and job-time variance so you can target bottlenecks. Display CSI Improvement metrics to connect advisor actions to customer experience and repeat business. Combine these KPIs with Advisor Engagement and Technician Motivation signals—activity, streaks, and recovery rates—so the team gets immediate, actionable feedback. Update every 15 minutes for continuous, data-driven performance management.
Set Targets, Rewards, and Fair Competition Rules
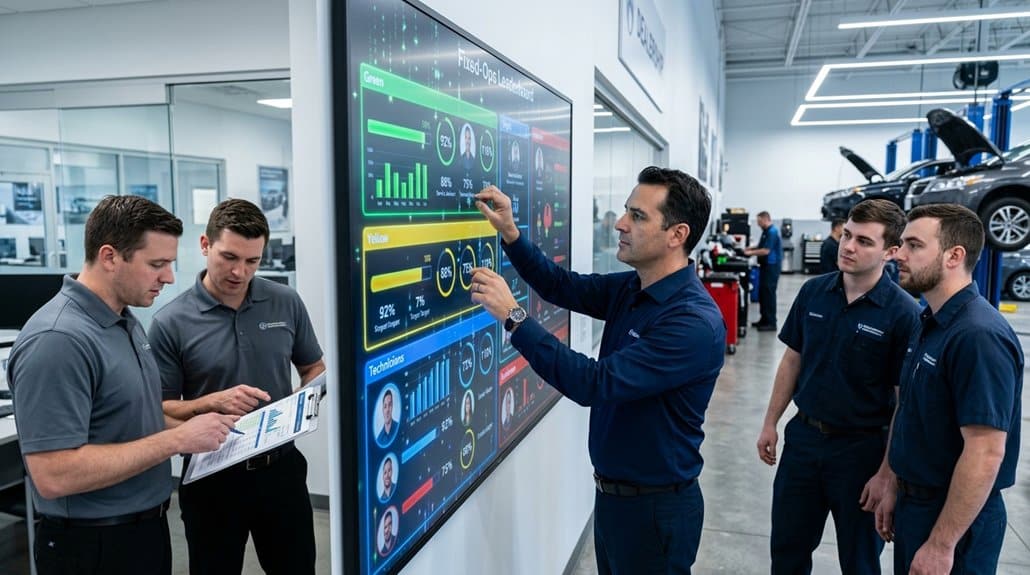
Set clear, measurable targets tied to metrics like Customer Pay RO Count and AROV so every advisor and technician knows the revenue expectations. Define transparent reward criteria—what thresholds earn real-time recognition on the 15-minute-updated leaderboard—and quantify payouts or perks. Enforce fair competition rules with individual and team goals plus CSI and ELR visibility to guarantee equal opportunity and measurable impact on dealership profitability.
Clear, Measurable Targets
Start by defining one or two precise, measurable targets—like raising Customer Pay RO count by 10% month-over-month—and tie them to specific timeframes and baseline metrics so every advisor and technician knows exactly what’s expected. Your target setting should map to clear performance metrics: RO count, average repair order value, and close rate. Use leaderboard data in real time to show progress against baselines and deadlines, letting staff adjust tactics quickly. Communicate targets weekly and display trending charts so performance gaps are obvious and actionable. Guarantee targets are attainable yet stretch goals, varying by role and experience to keep competition fair. Review and recalibrate monthly using objective data so incentives align with sustained improvements, not short-term spikes.
Transparent Reward Criteria
Although clarity around rewards often gets overlooked, transparent criteria are essential: you should set measurable targets (e.g., Customer Pay RO Count +15% MoM) so everyone knows what’s expected and why. Use reward transparency to publish a tiered rewards system tied to AROV and CSI, ensuring incentives track the metrics that move revenue and satisfaction. Apply uniform performance benchmarks across advisors and technicians to guarantee criteria fairness and equal opportunity, preventing disputes and encouraging collaboration. Feed real-time Fixed Ops Leaderboard data into daily coaching so individuals can adjust tactics immediately. Communicate standings in weekly meetings to reinforce accountability, celebrate progress, and calibrate targets. Clear, fair, and data-driven reward rules drive motivation and predictable improvements in fixed-ops performance.
Connect Your Leaderboard to DMS, CSI, and Daily Workflows
Connect your leaderboard to the DMS using secure API endpoints and standardized field mappings to guarantee ELR, OP-code saturation, and RO counts update in real time. Ingest CSI scores and timestamped feedback into the same feed so advisors see customer-impact metrics alongside productivity data every 15 minutes. Then set workflow automation triggers—alerts for falling CSI, flagging low ELR, or routing high-value ROs—to drive immediate, measurable corrective actions.
DMS Integration Best Practices
When you link your Fixed Ops Leaderboard to the DMS, CSI feeds, and daily workflows, you’ll get near real-time KPIs—updated roughly every 15 minutes—so advisors and technicians see accurate repair order counts, CSI scores, ELR, and OP-Code saturation without delay; that immediate visibility drives faster coaching, improves appointment adherence, cuts no-shows, and lets you run custom reports that pinpoint where to boost labor efficiency and profitability. Prioritize DMS security and system compatibility to protect customer data while ensuring seamless performance integration. Build for data accuracy with automated validation, clear dashboard design, and customization options that surface ELR and OP-code trends. Establish user training and feedback loops so advisors and techs adopt tools fast and you iterate reports based on frontline insights.
CSI Data Ingestion
If you link CSI feeds into your Fixed Ops Leaderboard and DMS, you’ll get near real-time visibility—updated about every 15 minutes—so service advisors can see their individual CSI scores alongside repair order counts and ELR, making it easy to spot performance gaps, drive targeted coaching, and improve customer retention through measurable actions. Use CSI Integration Strategies to map CSI scores to individual advisors and combine them with repair order and labor data. Real time Data Analytics lets you surface trends, outliers, and correlations that pinpoint training needs. Display rolling CSI averages on the leaderboard to drive accountability and healthy competition. With reliable ingestion and visualization, advisors understand their direct impact on satisfaction, managers deploy focused coaching, and retention improves through measurable, data-driven interventions.
Workflow Automation Triggers
Although it might seem like just another dashboard feature, tying workflow automation triggers to your Fixed Ops Leaderboard and DMS delivers measurable results—updating every 15 minutes so you can auto-schedule appointments, flag at-risk CSIs, and push performance alerts tied to RO counts and ELR to the right advisor or tech instantly.
You’ll use workflow triggers to translate real-time DMS and CSI data into actions: auto-book follow-ups, escalate low CSI scores, and notify advisors when RO counts dip. That immediacy reduces no-shows, improves retention, and creates transparent accountability. Performance alerts recognize top technicians and correct course for underperformers, driving measurable lifts in throughput and labor efficiency. Implement rules, thresholds, and channels for alerts, then monitor impact on KPIs.
| Trigger | Action |
|---|---|
| Low CSI | Escalate to advisor |
| High RO count | Reward alert |
| No-show risk | Auto-schedule |
| Low ELR | Coach prompt |
Show Performance Well: TV, Mobile, and Desktop Best Practices
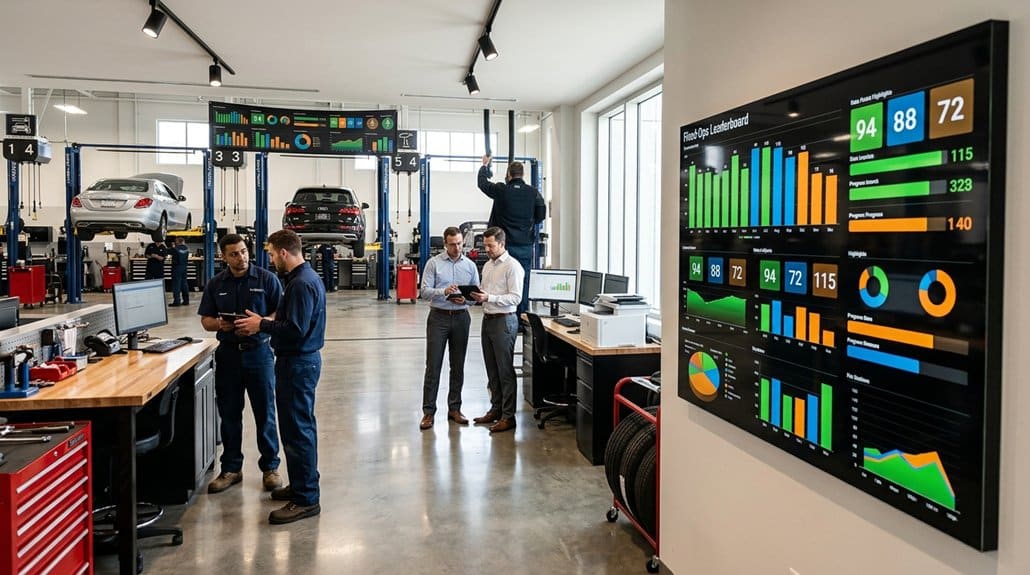
Because real-time visibility drives behavior, you should present KPIs across TVs, mobile, and desktops with clarity and cadence so every advisor and technician knows exactly where they stand and what to do next. Use dynamic displays that auto-refresh every 15 minutes to sustain real-time engagement and performance motivation. Tailor views for individual and team metrics to sharpen focus, boost visual recognition, and stoke competitive spirit. Guarantee mobile accessibility so staff adjust tactics on-the-go. Leverage digital signage for quick wins and culture-building.
Show real-time KPIs—TVs, mobile, desktops—auto-refreshing every 15 minutes to focus teams, drive action, and celebrate wins.
- TV dashboards: big, bold metrics for floor-wide awareness
- Mobile app: on-demand access, push alerts for changes
- Desktop widgets: detailed drill-downs for coaching
- Recognition slides: celebrate achievements instantly
- Update cadence: 15-minute auto-refresh for accuracy
Measure ROI and Drive Continuous Improvement
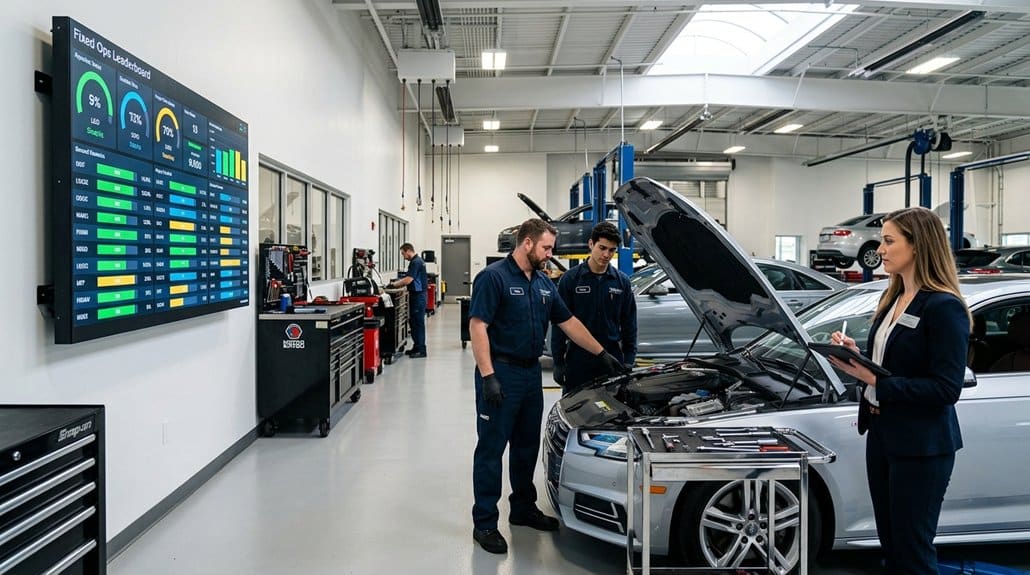
Now that your team sees real-time KPIs across TV, mobile, and desktop, you can quantify how those visibility gains translate to the bottom line by measuring ROI and driving continuous improvement. Use ROI measurement strategies that link advisor and technician actions to Customer Pay RO Count, AROV, ELR, and OP-Code Saturation Rate so every leaderboard change maps to revenue and margin. Update displays every 15 minutes to keep accountability tight and to surface trends for targeted coaching. Track before/after performance to validate training, then iterate using continuous improvement techniques: root-cause analysis, focused coaching, and process tweaks. With data-driven leaderboards you’ll prioritize interventions that boost profitability, sustain motivation, and prove the financial impact of your fixed ops investments.
Frequently Asked Questions
What Do Fixed Ops Do at a Dealership?
Fixed ops run your service, parts, and collision operations to maximize revenue and retention; they drive service excellence, enforce technician training, track KPIs like ELR/efficiency, and optimize workflows to boost CSI and profitability.
What Is the Highest Paid Position at a Car Dealership?
Obviously, you’ll bow to the General Manager—satirically crowned king—who earns the highest salaries in the dealership hierarchy. Data show GMs often top $150,000, reflecting leadership responsibility and impact on profitability and results.
What Three Departments Comprise the Fixed Operations of a Dealership?
They’re the Service Department, Parts Department, and Collision Repair Department. You’ll focus on service department dynamics and technician performance metrics to drive efficiency, boost retention, and maximize fixed‑ops profitability through measurable, results-oriented actions.
What Is the Biggest Challenge in Selling Cars Today?
You’ll face one challenging truth: market saturation paired with shifting consumer preferences is the biggest challenge. You’ll need data-driven targeting, refined online engagement, and measurable CX improvements to regain sales velocity and capture scarce buyer attention.
Conclusion
Think of your fixed ops leaderboard as a scoreboard that tattles on slackers and crowns hustlers — and yeah, it’s got the data to back it. Track ROs, ELR, efficiency and CSI, set fair targets, plug into DMS/CSI, and blast results to TVs and phones. Measure ROI, tweak relentlessly, and reward real gains. Do this, and you’ll turn vague effort into measurable profit, not motivational fluff.