You need live DMS sales leaderboards because they give you synchronized, real‑time KPIs so you can act the moment inventory, service, or sales diverge from targets. Live dashboards cut decision latency versus static reports, drive roughly 15% service revenue uplift and 10% less aged parts through better scheduling and inventory control, and boost staff engagement with transparent incentives. Prioritize DMS compatibility, mobile access, and automated alerts, and you’ll see faster corrective action and measurable ROI—keep going to learn how.
Key Takeaways
- Live DMS leaderboards deliver real-time metrics for instant decisions, unlike static reports that lag and obscure trends.
- Continuous DMS syncing ensures data accuracy, reducing errors from manual exports and stale spreadsheets.
- Customizable KPIs update live to spotlight underperforming teams, SKUs, or workflows for immediate corrective action.
- Mobile and desktop access plus automated alerts improve responsiveness across sales, service, and parts teams.
- Transparent, live metrics boost staff engagement and enable incentive alignment that drives measurable revenue and inventory gains.
Why Live DMS Sales Leaderboards Outperform Static Reports
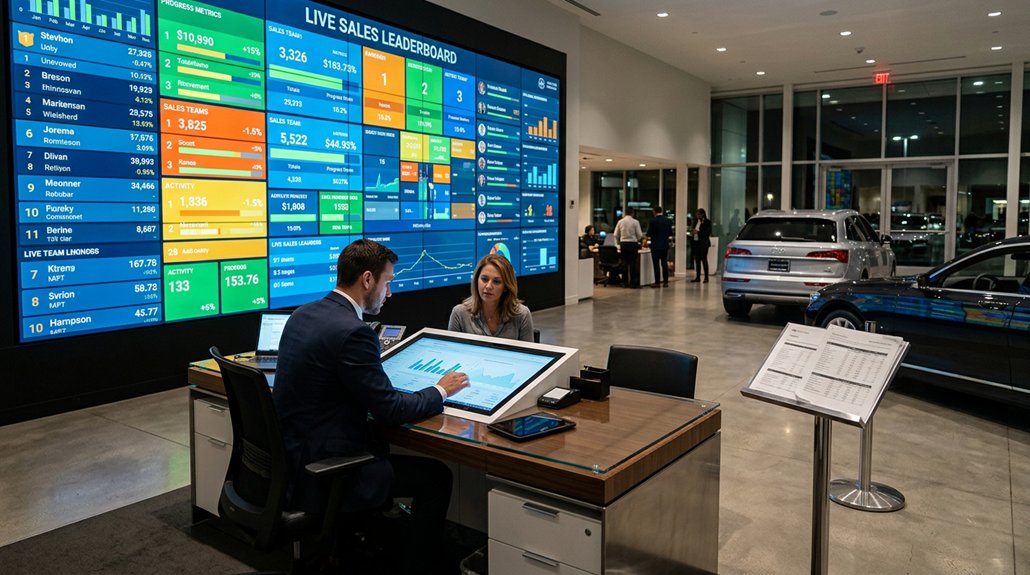
Because timing dictates outcomes in dealership sales, live DMS leaderboards beat static reports by delivering real-time, actionable metrics that let you pivot instantly—rather than react to stale data. You’ll get continuous data accuracy because the leaderboard syncs with the DMS, removing reporting lag and manual reconciliation. That precision strengthens performance tracking: customizable KPIs update live so you can spot declines, allocate resources, or reward wins the moment they occur. You’ll also use cross-functional visibility to diagnose bottlenecks—sales, finance, and service metrics appear in one pane, enabling coordinated interventions. By replacing snapshots with a living dashboard, you’ll reduce decision latency, improve accountability through immediate recognition, and focus coaching where it’s measurable and timely.
Expected ROI: Revenue Lift, Inventory Reduction, and Staff Engagement
When you connect live DMS leaderboards to daily operations, you’ll see measurable ROI across revenue, inventory, and engagement: You’ll get ~15% service revenue uplift from optimized scheduling and immediate performance tracking, and a ~10% reduction in aged parts through better inventory management and demand forecasting. Live dashboards drive employee motivation and accountability, improving conversion during seasonal spikes. Use these metrics to quantify revenue growth, tighten inventory management, and formalize performance tracking.
| Metric | Typical Impact | Strategic Action |
|---|---|---|
| Service Revenue | +15% | Optimize tech schedules |
| Aged Inventory | -10% | Adjust stocking cadence |
| Staff Engagement | +High | Publicize targets |
| Decision Speed | Faster | Real-time alerts |
Measure changes quarterly and tie incentives to transparent KPIs.
How Real-Time Visibility Reshapes Daily Dealership Decisions

Although real-time DMS leaderboards look simple, they give you immediate, actionable visibility into sales, service, and parts performance so managers can spot shortfalls and redeploy resources within hours instead of days. With real time insights, you’ll identify underperforming teams or SKUs the moment trends diverge from targets and trigger automated alerts for key performance metrics. That lets you reassign staff, adjust promotions, or shift inventory focus before revenue is lost. Integrated leaderboards eliminate reporting lag and data silos, so everyone uses the same up-to-date inputs for tactical decisions. The result is faster corrective action, clearer accountability, and measurable uplifts in throughput and engagement—turning daily operational monitoring into a continuous competitive advantage.
How to Pick the Right Live Sales Leaderboard (DMS Integration, KPIs, Alerts, Pricing)
Anyone selecting a live sales leaderboard should start by confirming seamless DMS integration and real-time syncing so your performance metrics across sales, service, and parts are accurate and immediate. You’ll prioritize DMS compatibility, KPI customization, mobile/desktop access, automated alerts, and predictable pricing. Choose KPIs that map to goals—sales volume, CSI, gross—and guarantee alerts trigger on defined thresholds so you can act fast. Evaluate vendor pricing (many start near $499/mo) against expected ROI from improved accountability. Below is a quick feature checklist to compare vendors.
| Feature | Importance | Notes |
|---|---|---|
| DMS compatibility | High | Real-time sync |
| KPI customization | High | Align to goals |
| Alerts | Medium | Threshold-based |
| Pricing | Medium | $499+/mo |
| Accessibility | High | Mobile & desktop |
Quick Rollout Checklist: Integration, Training, Timeline, and Measuring Success

Start by mapping your DMS and leaderboard requirements to a concise rollout plan so you can go live fast and avoid integration hiccups: confirm real-time compatibility with platforms like CDK Global or Dealertrack, schedule a three- to five-day installation window post-order, and build a training timeline that phases staff through hands-on sessions and quick-reference materials. Next, inventory integration challenges—API limits, field-mapping, and permissioning—and assign remediation owners with clear SLAs. Design training to maximize training effectiveness: role-based modules, one-hour practical labs, and 30-day follow-ups. Define KPIs up front (sales lift, conversion rate, engagement) and instrument dashboards for daily monitoring. Close the loop with weekly feedback reviews and iterative tweaks so you can quantify ROI and drive continuous improvement.
Frequently Asked Questions
What Is the Red Flag Rule for Auto Dealers?
The Red Flag Rule requires you to implement an Identity Theft Prevention Program to detect red flag indicators (mismatched IDs, unusual behavior, odd payment requests) and maintain dealer compliance through policies, training, monitoring, and timely response.
How Much Does a Car Salesman Make off a $20,000 Car?
You’d typically earn about $1,000–$2,000 on a $20,000 car, depending on commission structure and sales incentives; variations occur from flat fees, tiered rates, financing splits, and bonuses tied to volume or targets.
What Is the Hardest Month to Sell a Car?
February is usually the hardest month to sell a car. You’ll see seasonal trends showing 10–15% lower volume; use targeted sales strategies, promotions, and inventory management to offset weather and end-of-model-year demand drops.
What Is the Difference Between CRM Sold and DMS Sold?
CRM Sold tracks customer-centric transactions; DMS Sold records operationally integrated sales. You’ll use CRM Insights for engagement and retention, DMS Metrics for inventory/financial accuracy, aligning both to boost Sales Performance and guarantee Data Accuracy.
Conclusion
You’ll love how static reports make you wait for answers while your competition sells the cars you’re still counting—so switch to live DMS leaderboards. Real-time visibility drives measurable lifts in revenue, cuts days-on-lot, and boosts staff activity by turning KPIs into instant incentives. Pick an integrated, KPI-focused, alert-enabled solution, roll it out fast, and measure daily. If you’d rather stay comforting with yesterday’s numbers, don’t expect today’s results.