Dealership owners often juggle numbers from many stores. Data lives in different systems, so reporting slows down and Visibility fades. Without clear Analytics and Reporting, teams miss Performance trends and Decisionmaking suffers.
While managers hunt through spreadsheets, faster groups use real-time dashboards and act right away. Delays drain morale and let rivals grab easy wins.
Digital Dealership Systems offers Management Dashboards powered by DIS Quantum and Microsoft Power BI. Power BI is a data analysis platform that turns raw data into simple visuals. With everything in one place, leaders see what is happening across every store in seconds.
This guide shows how the dashboards boost insight, compare sales between locations, track KPIs, and cut wasted effort. Sticking with old tools costs money and time. Keep reading to see a clearer path to growth.
Key Takeaways
- Dealer Principal Management Dashboards unify data from all stores in real time, giving instant Visibility into sales and inventory health.
- Microsoft Power BI integration tracks key performance indicators, or KPIs, such as gross profit, employee results, and inventory turnover for smarter choices.
- Automated Reporting replaces manual spreadsheets, saving hours and lowering the risk of errors.
- Mobile-friendly views let leaders check metrics on any device, so they can respond quickly to market shifts and stock gaps.
- Digital Dealership’s integrated approach lifts ROI by improving efficiency, supporting role-based insights, and turning Analytics into clear action.
What are the key features of dealer principal management dashboards?
Missing data and slow reports cost stores real money. The Digital Dealership dashboard brings clear Visibility to every location with tools built for speed and accuracy.
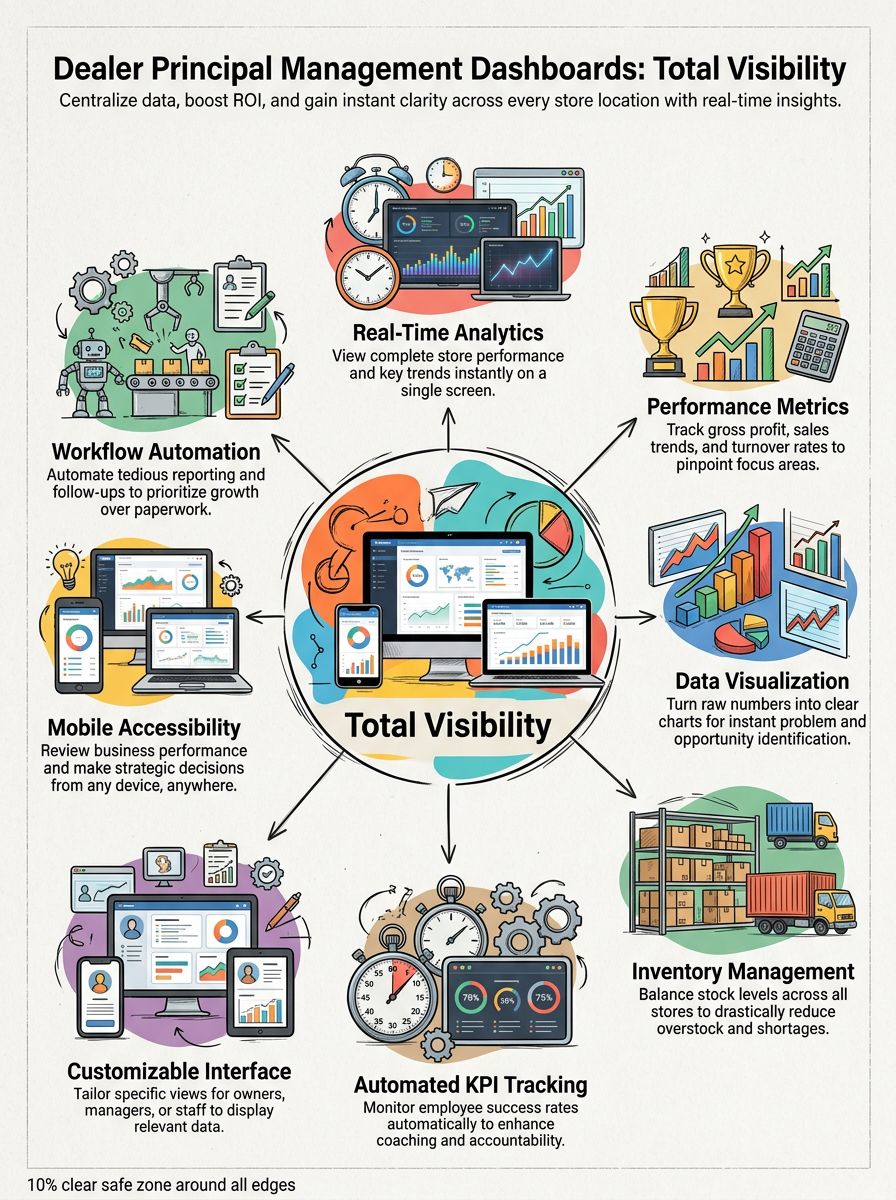
- Real-time dashboard analytics provide a live snapshot of each store on one screen, so trends and changes are easy to spot.
- Performance metrics track gross profit, sales pace, and inventory turnover. Inventory turnover means how often vehicles sell and get replaced.
- Data visualization turns numbers into charts and graphs, helping managers see issues and wins at a glance.
- Cross-location inventory management balances stock across rooftops, cutting carrying costs and preventing shortages.
- Key performance indicators, or KPIs, include employee win rates and close ratios. These numbers guide coaching and accountability.
- A customizable interface lets owners, managers, and staff see the details that matter to their role, not extra noise.
- Mobile access keeps leaders connected anywhere. Check Retail Analytics from a phone or tablet and plan next steps fast.
- Automation handles daily Reporting like scheduled summaries and alerts, freeing teams to focus on selling and service.
Dealerships stuck on manual methods fall behind. Digital Dealership’s dashboards deliver clear, shared insight across all stores and help teams win more deals this year.
What operational benefits come from having visibility across multiple stores?
Empty showrooms and crowded lots both hurt cash flow. Without shared Analytics, leaders guess instead of act, and small problems get expensive.
Unified data exposes waste early. Overstocks stop tying up cash. Underperforming teams get support before the month is lost. Role-based views keep each stakeholder focused on goals that matter most.
Cross-location inventory management moves the right vehicles to the right lot. For example, if trucks sit on one lot and sell fast in another, a quick transfer turns slow stock into profit.
With instant Visibility, managers do not wait for month-end recaps. They spot a slide in test drives today and adjust marketing or pricing today. That speed improves Operational Oversight and lifts Performance across the group.
Digital Dealership built its dashboards to make resource moves in minutes, not weeks. The result is smoother operations, less guesswork, and better outcomes across every store.
How do dashboards help improve decision-making across dealerships?
Many dealer principals face mixed results, patchy data, and slow updates. Spreadsheets hide the story, so real Business Intelligence never reaches the sales floor.
These gaps cause missed sales, stressed teams, and higher costs from poor stocking. Groups that run modern platforms react faster and keep their edge.
Digital Dealership dashboards, powered by Microsoft Power BI, bring live Performance metrics and easy Data Visualization to every screen. Custom views show each user what matters most. Owners track profit and cash. Sales leaders watch lead flow and close rate. Service managers monitor hours sold and parts turns.
Automated tracking replaces manual Reporting, so leaders move from waiting to acting. Integration across stores balances inventory, trims carrying costs, and improves margins.
This setup puts control in the hands of decision makers. Clear Analytics guide the next step, and steady Decisionmaking becomes the norm, not the exception.
Conclusion
Hanging on to slow tools keeps dealerships in the dark. Disconnected reports and manual entry waste time and block clear Visibility across the group.
Stores that switch to Digital Dealership Management Dashboards gain real-time KPIs, stronger Data Visualization, and simple dashboard Reporting across locations. KPIs are the most important numbers that show progress, such as gross per unit and days to sell.
Integrated management brings clarity and faster oversight. Leaders get instant access to Retail Analytics for sales performance, inventory turnover comparisons, and actionable insights that support reactivation and growth.
The old way holds businesses back. See how Digital Dealership delivers sharper Analytics, smarter Decisionmaking, and better Performance across all stores. Step into clear visibility and outpace the competition starting now.
FAQs
1. What is a Dealer Principal Management Dashboard and how does it help with visibility across all stores?
A Dealer Principal Management Dashboard gives you real-time access to key performance data for every location in your network. With this tool, you can compare sales, inventory, service metrics, and financials side by side. This clear view helps you spot trends quickly and make informed decisions that boost efficiency.
2. How do these dashboards improve decision-making for dealer principals?
These dashboards present accurate data from each store on one screen; no more switching between systems or waiting for reports. You see what matters most—profit margins, customer satisfaction scores, stock levels—all updated instantly. Fast insights mean faster action when opportunities or issues arise.
3. Are the management dashboards secure and reliable for sensitive business information?
Yes; top-tier security protocols protect your dealership’s confidential data at every step of the process. Only authorized users gain access through multi-factor authentication controls and encrypted connections safeguard all transmissions.
4. Can I customize my dashboard to focus on specific areas important to my dealership group?
Absolutely! Tailor your dashboard views to highlight the KPIs that matter most—whether it’s new vehicle sales volume, aftersales revenue streams, or staff productivity rates across locations. Custom filters let you drill down into details so you always have relevant information at hand…ready whenever you need it.
Ready to transform your operations with complete visibility? Contact us today or visit our website for a personalized demo tailored just for your dealership group!