
Digital Dealership System · Knowledge Base
Intelligence for the modern dealership.
A centralized reference for products, placement, implementation, integrations, terminology, security, and support.
What Digital Dealership System Does
Digital Dealership System helps car dealerships use screens strategically across the store. Some screens are for customers. Other screens are for employees. The product, message, design, and placement must always match the audience.
The Simple Explanation
Digital Dealership System places the right dealership information on the right screen, in the right part of the dealership, for the right audience.
Customer Communication
Lounge TVs, service status screens, digital service menus, showroom displays, welcome boards, delivery boards, and video walls help customers feel informed and confident.
Staff Performance
Sales leaderboards, fixed ops leaderboards, technician displays, BDC trackers, and executive dashboards help employees and leaders see goals, pace, rankings, and performance.
Dealership-Specific
This is not generic signage. It is dealership communication, performance visibility, and customer experience delivered through screens already inside the store.
How Digital Dealership System Works
Digital Dealership System combines dealership data, managed content, display hardware, and screen-placement strategy to deliver the appropriate information to each audience inside the store.
Connected performance products retrieve approved information from supported dealership systems and organize it into role-appropriate dashboards and leaderboards.
Customer communication products use dealership-controlled content, status information, promotions, education, or entertainment selected for the screen’s location.
Content is displayed on televisions and other authorized devices through the dealership’s configured Digital Dealership System environment.
Different screens can show different products, layouts, messages, or metrics according to department and audience.
Authorized managers can review selected information on supported desktop, tablet, or mobile views when included in the dealership’s configuration.
Update timing
Sales Leaderboard information may update in real time when supported by the dealership’s integration and configuration. Fixed Operations information typically updates every 15 minutes. Customer-facing promotional and educational content updates according to the dealership’s publishing and scheduling settings.
Digital Dealership System Product Library
Sales Leaderboard Basic
Sales Performance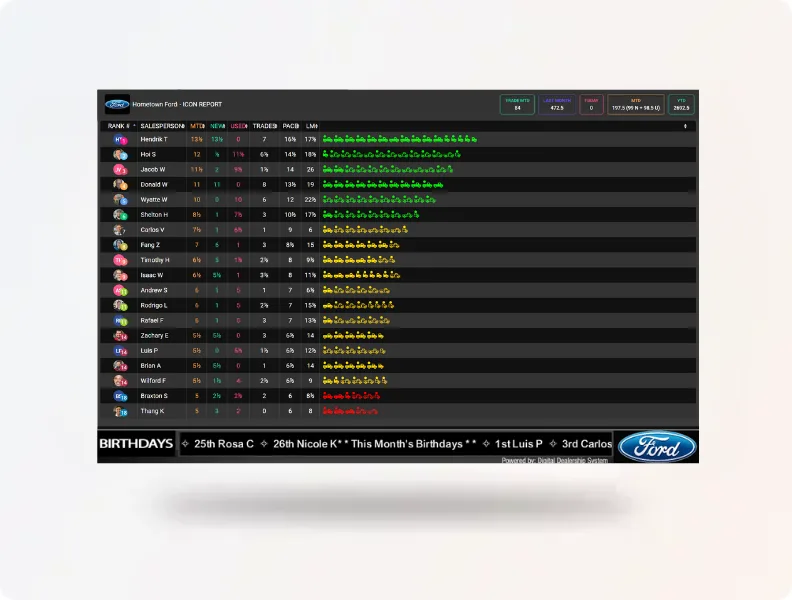
A DMS-connected sales performance display that replaces manually updated boards with a clear view of essential sales results.
Who it is for
- Dealer principals and general managers
- General sales managers and sales managers
- Desk managers and sales consultants
Where it belongs
- Sales towers and desk-manager areas
- Sales management offices
- Staff-facing showroom walls
- Conference rooms and employee areas
What dealerships can monitor
- Units sold and pending deals
- Individual salesperson performance
- Gross and sales trends
- Month-to-date progress
Business value
- Replaces manually maintained sales boards
- Keeps essential results visible throughout the day
- Supports recognition, coaching, and accountability
- Gives managers faster access to current performance
Sales Leaderboard Pro
Sales Performance
A customizable sales performance platform with expanded KPI reporting, goals, alerts, CSI, finance, team, and storewide visibility.
Who it is for
- Dealer principals and general managers
- General sales managers and sales managers
- Finance and BDC leadership
- Corporate dealership leadership
Where it belongs
- Sales towers and management offices
- General manager offices
- Leadership meeting rooms
- Authorized desktop and mobile devices
What dealerships can monitor
- Units, gross, pace, and goals
- CSI and closing performance
- Salesperson, manager, and finance results
- Vehicle, brand, model, and storewide trends
Business value
- Provides a broader view of sales performance
- Supports more targeted coaching and goal management
- Helps leaders identify opportunities sooner
- Creates consistent reporting across teams
Enterprise Leaderboard
Sales Performance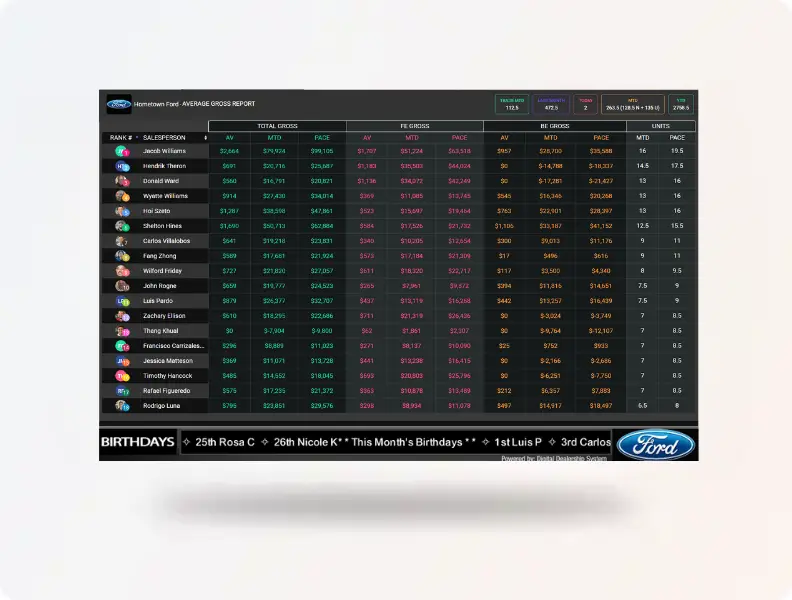
A multi-location performance solution that compares stores, groups, or regions through customized reporting on televisions, desktops, and mobile devices.
Who it is for
- Dealer groups and ownership teams
- Regional and corporate leaders
- General managers and department executives
- Multi-rooftop operations teams
Where it belongs
- Corporate dealership offices
- Regional offices
- Executive meeting rooms
- Authorized desktop and mobile devices
What dealerships can monitor
- Store and region comparisons
- Sales and service performance by location
- Group goals and pace
- Cross-store trends and rankings
Business value
- Creates consistent visibility across locations
- Helps leadership identify strong and underperforming stores
- Supports groupwide accountability
- Reduces reliance on separately prepared store reports
Fixed Ops Leaderboard
Fixed Operations Performance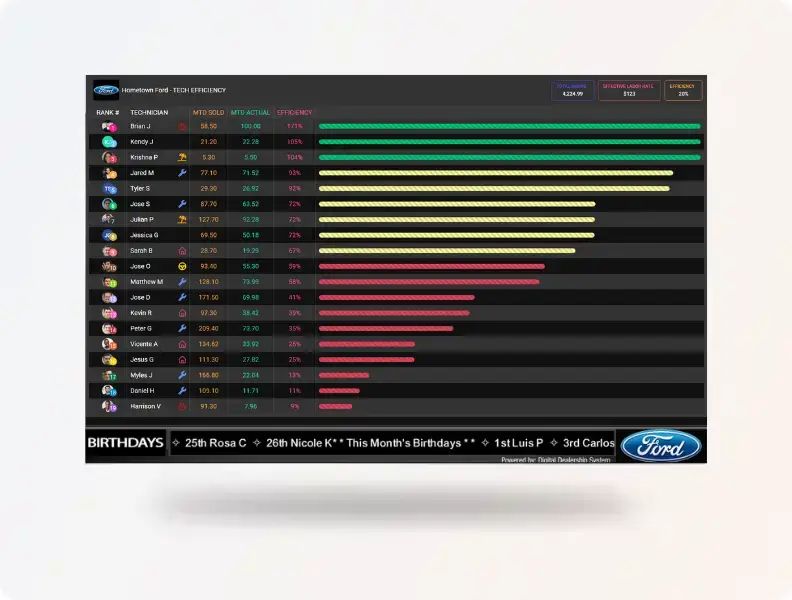
A DMS-connected service and technician KPI platform that gives fixed operations teams current performance visibility, typically updated every 15 minutes.
Who it is for
- Fixed operations directors and service directors
- Service managers and shop foremen
- Service advisors and technicians
- Dealer principals and general managers
Where it belongs
- Technician shops and service bays
- Dispatch and shop-foreman areas
- Service management offices
- Authorized leadership devices
What dealerships can monitor
- Repair orders, hours, and labor sales
- Advisor and technician performance
- Effective labor rate and hours per repair order
- Goals, pace, aging, and operational delays
Business value
- Makes fixed operations performance visible during the day
- Supports coaching and accountability
- Helps teams identify delays and missed opportunities sooner
- Reduces manual performance reporting
Service Advisor Tracking
Fixed Operations Performance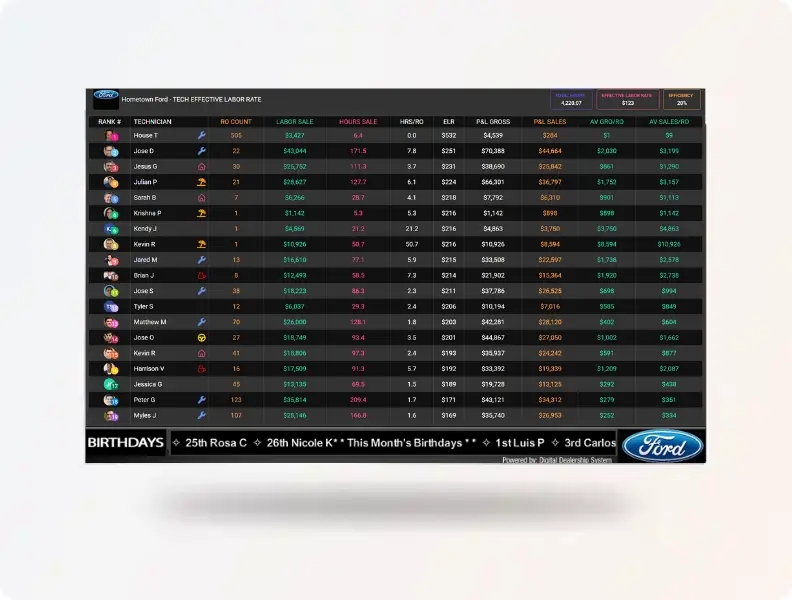
A focused advisor-performance display for monitoring customer activity, revenue, goals, productivity, and service results.
Who it is for
- Service advisors and advisor managers
- Service managers and directors
- Fixed operations leadership
- General managers
Where it belongs
- Advisor back offices
- Service management offices
- Staff-facing service reception areas
- Leadership meeting rooms
What dealerships can monitor
- Appointments and show rate
- Revenue, gross, and hours sold
- Advisor goals and pace
- CSI, productivity, and close performance
Business value
- Clarifies expectations for each advisor
- Supports measurable coaching conversations
- Makes performance differences easier to identify
- Connects advisor activity to department results
Tech ELR Leaderboard
Fixed Operations PerformanceA technician-focused leaderboard for monitoring effective labor rate, efficiency, hours, gross or net results, and daily performance trends.
Who it is for
- Technicians and shop foremen
- Dispatchers and service managers
- Fixed operations directors
- Dealership leadership
Where it belongs
- Technician shops and service bays
- Shop-foreman and dispatch stations
- Service management offices
What dealerships can monitor
- Technician ELR
- Efficiency and productivity
- Hours sold and daily trends
- Technician gross, net, and goal progress
Business value
- Keeps technician performance visible
- Supports recognition and coaching
- Helps identify productivity and labor-rate opportunities
- Creates clearer shop accountability
Service Promise Time Report
Fixed Operations Performance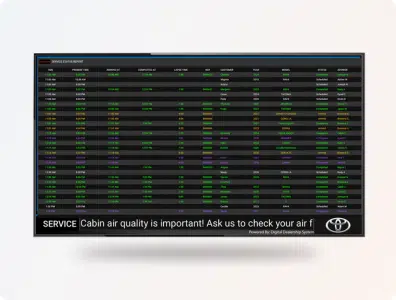
An operational display that identifies repair orders at risk of missing, or already exceeding, the promised completion time.
Who it is for
- Service managers and directors
- Dispatchers and shop foremen
- Service advisors
- Fixed operations leadership
Where it belongs
- Dispatch areas
- Service management offices
- Advisor back offices
- Technician shop management screens
What dealerships can monitor
- Promised completion times
- Repair-order status and aging
- Vehicles approaching delay thresholds
- Overdue work and responsible workflow stage
Business value
- Helps teams act before delays affect customers
- Improves workflow visibility
- Supports more proactive customer communication
- Reduces overlooked or aging repair orders
BDC Lead Tracker
BDC Performance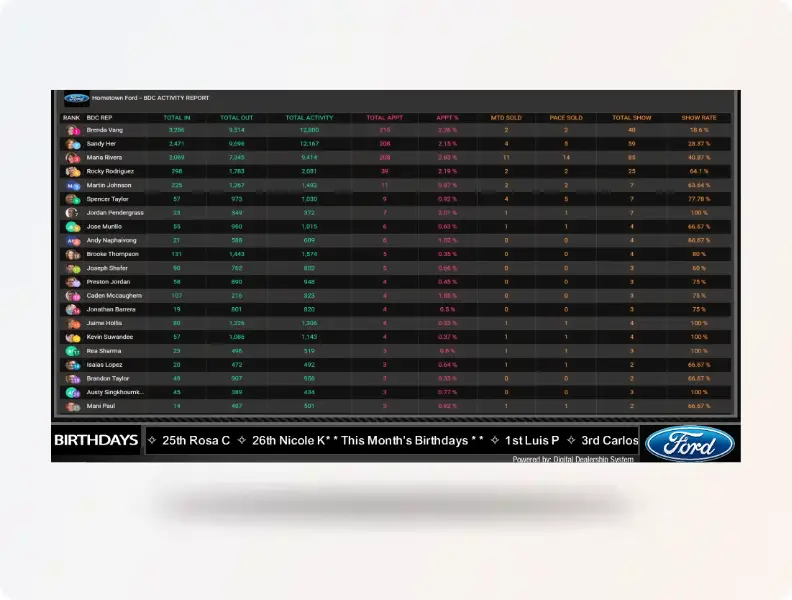
A lead-source performance display that brings total, sold, lost, active, and bad leads into one view.
Who it is for
- BDC directors and managers
- Internet sales managers
- Sales managers and general managers
- Dealer group leadership
Where it belongs
- BDC and internet sales offices
- Call centers
- BDC manager offices
- Sales leadership areas
What dealerships can monitor
- Lead totals by source
- Sold, lost, active, and bad lead percentages
- Lead-source contribution
- Conversion and opportunity trends
Business value
- Shows which lead sources produce meaningful results
- Helps managers find poor-quality or underworked leads
- Supports better source evaluation
- Improves visibility into conversion performance
BDC Outbound Goal Tracker
BDC Performance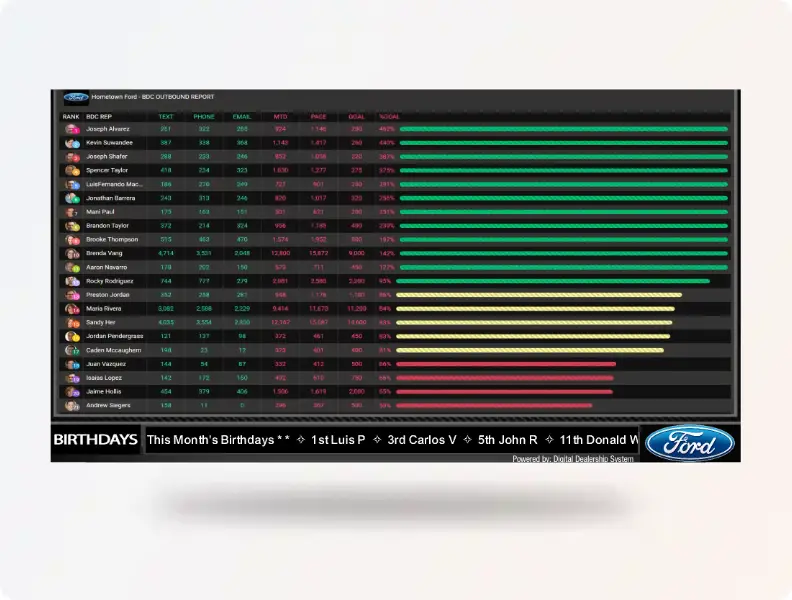
A visual goal display that shows progress toward daily outbound call, text, email, and appointment-setting targets.
Who it is for
- BDC representatives and managers
- Internet sales teams
- Sales managers
- Dealer principals and general managers
Where it belongs
- BDC offices and call centers
- Internet sales departments
- Team meeting areas
What dealerships can monitor
- Outbound calls, texts, and emails
- Appointments set
- Individual and team goals
- Progress and pace throughout the day
Business value
- Keeps daily activity goals visible
- Encourages consistent follow-up
- Helps managers intervene before the day ends
- Connects outbound effort to appointments
BDC Activity Tracking
BDC PerformanceA broader BDC performance view that connects inbound and outbound activity with appointments, shows, and completed sales.
Who it is for
- BDC representatives and managers
- Internet sales managers
- Sales leadership
- Dealer group leadership
Where it belongs
- BDC offices
- Call centers
- Sales towers
- Manager and leadership offices
What dealerships can monitor
- Inbound and outbound activity
- Appointments set, confirmed, and shown
- Sales and conversion rates
- Individual and team performance
Business value
- Connects daily effort to dealership outcomes
- Improves accountability for follow-up
- Supports coaching around set, show, and sold performance
- Makes missed opportunities easier to identify
Basic Lounge TV
Customer Lounge TV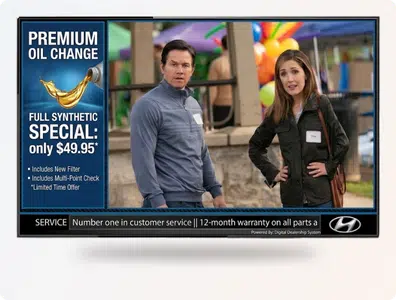
A dealership-controlled lounge television experience combining commercial-free programming or live television with dealership marketing, promotions, entertainment, and a customizable ticker.
Who it is for
- Fixed operations and service leaders
- Marketing and customer-experience teams
- General managers and dealer principals
Where it belongs
- Customer lounges and waiting rooms
- Coffee and family areas
- Customer seating and reception areas
What dealerships can monitor
- Dealer promotions and service messaging
- Entertainment and informational content
- Ticker announcements
- Seasonal and community content
Business value
- Gives the dealership control of the waiting-room message
- Removes unrelated or competitor advertising
- Promotes services while customers wait
- Creates a more professional customer experience
DMS Status Lounge TV
Customer Lounge TV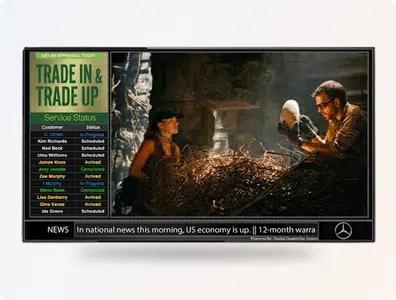
A lounge television solution that combines DMS-connected service-status updates with dealership marketing, entertainment, and ticker content.
Who it is for
- Service directors and managers
- Service advisors
- Customer-experience teams
- Dealership leadership
Where it belongs
- Customer lounges and waiting rooms
- Service reception seating areas
- Cashier or pickup waiting areas
What dealerships can monitor
- Vehicle service status
- Customer-safe progress stages
- Dealer promotions and announcements
- Entertainment and ticker content
Business value
- Keeps customers informed without dedicating the entire screen to status
- Reduces repeated status questions
- Supports dealership marketing during the wait
- Creates a more transparent service experience
Commercial Replacement TV
Customer Lounge TV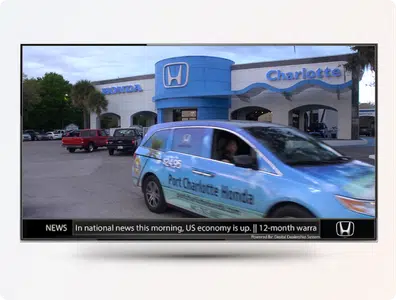
A patented live-television solution that replaces commercial breaks with dealership videos, promotions, and messages.
Who it is for
- Dealer principals and general managers
- Marketing directors
- Fixed operations and customer-experience leaders
Where it belongs
- Customer lounges
- Showroom seating areas
- Reception and finance waiting areas
- Customer cafés
What dealerships can monitor
- Dealership videos and promotions
- Replacement messages during commercial breaks
- Live television programming
- Scheduled campaigns
Business value
- Prevents outside advertisers from controlling the dealership screen
- Uses commercial breaks for dealership messaging
- Preserves familiar live television programming
- Strengthens the in-store brand environment
DMS Service Status Menu
Service Drive and Service Area Displays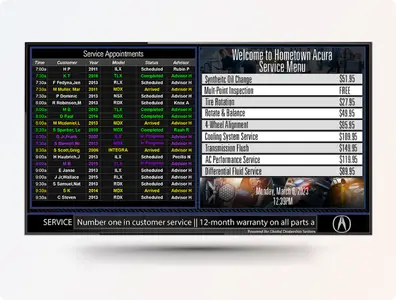
A customer-facing service display that combines repair-status information with service menus, promotions, and dealership messaging.
Who it is for
- Service customers and advisors
- Service managers and directors
- Customer-experience teams
Where it belongs
- Service reception and write-up areas
- Customer lounges
- Cashier and vehicle-pickup areas
What dealerships can monitor
- Vehicle status and workflow stages
- Service menu content and pricing
- Maintenance promotions
- Customer instructions and announcements
Business value
- Combines operational communication and marketing on one screen
- Reduces status questions
- Supports advisor conversations
- Improves customer understanding of the service process
Digital Service Menu
Service Drive and Service Area Displays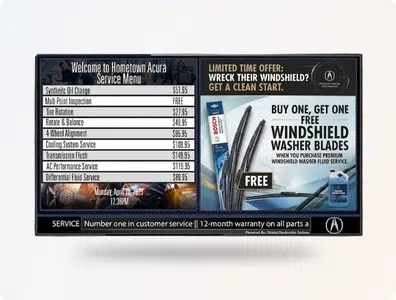
A digital menu board that presents maintenance services, packages, pricing, recommendations, and dealership service benefits.
Who it is for
- Service customers
- Service advisors and managers
- Fixed operations and marketing leaders
Where it belongs
- Advisor write-up counters
- Service reception
- Customer-facing service walls
- Customer lounges when used for education
What dealerships can monitor
- Service packages and pricing
- Recommended and seasonal maintenance
- Tire, battery, brake, and fluid services
- Service specials and dealership benefits
Business value
- Makes service options easier to understand
- Supports more consistent advisor presentations
- Keeps pricing and promotions current
- Reduces dependence on printed menus
XTIME Service Menu
Service Drive and Service Area Displays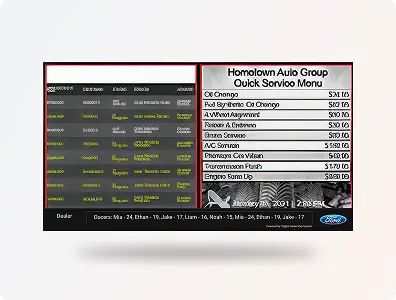
A connected service display that combines XTIME service-status information with service-menu and dealership marketing content.
Who it is for
- Dealerships using XTIME workflows
- Service customers and advisors
- Service managers and fixed operations leaders
Where it belongs
- Service reception
- Advisor write-up areas
- Customer lounges
- Cashier and pickup areas
What dealerships can monitor
- XTIME service-status updates
- Service packages and pricing
- Maintenance recommendations
- Dealer marketing and promotions
Business value
- Brings connected status and customer education together
- Supports XTIME-based service workflows
- Reduces customer uncertainty
- Makes service marketing more relevant to the visit
Welcome Board
Service Drive and Service Area Displays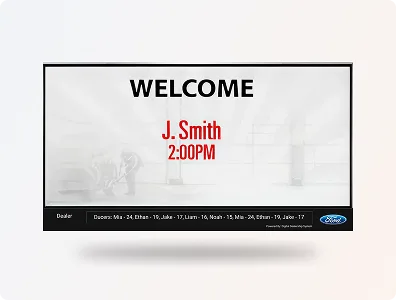
A customer-facing board that welcomes scheduled guests and helps organize arrival, appointment, and advisor-assignment information.
Who it is for
- Sales and service customers
- Receptionists, greeters, and advisors
- Sales and service managers
Where it belongs
- Dealership entrances and reception areas
- Service check-in areas
- Vehicle delivery areas
What dealerships can monitor
- Scheduled appointments
- Customer welcome messages
- Advisor or salesperson assignments
- Arrival instructions and dealership announcements
Business value
- Creates a more organized arrival experience
- Helps customers know where to go
- Supports a more personal welcome
- Reduces confusion at check-in
Dare to Compare
Service Drive and Service Area Displays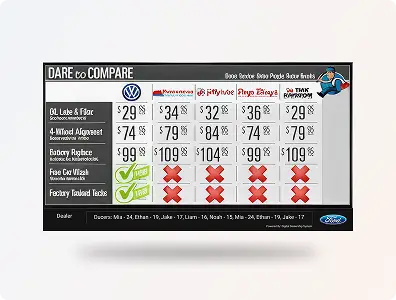
A customer-education display that explains why dealership service offers value beyond the advertised price of an independent repair.
Who it is for
- Service customers
- Service advisors and managers
- Customer-retention and marketing leaders
Where it belongs
- Advisor write-up areas
- Service reception
- Customer lounges
- Service checkout areas
What dealerships can monitor
- Factory-trained technician benefits
- OEM parts and approved procedures
- Warranty-backed repairs and diagnostic expertise
- Amenities, transportation, and dealership advantages
Business value
- Supports advisor conversations about value
- Addresses price objections
- Builds trust in dealership expertise
- Helps improve service retention
Trade-In Announcements
Service Drive and Service Area Displays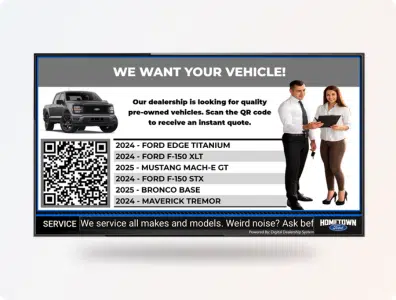
A service-area display that highlights vehicles the dealership wants to purchase and directs customers to a trade or appraisal path, often through a QR code.
Who it is for
- Service customers
- Used-car and acquisition managers
- Sales and marketing teams
- Dealer principals and general managers
Where it belongs
- Service lounges and reception areas
- Service drive waiting areas
- Cashier and pickup areas
What dealerships can monitor
- Wanted vehicle makes or models
- Trade-in and appraisal messaging
- QR-code calls to action
- Current acquisition campaigns
Business value
- Turns service traffic into acquisition opportunities
- Supports used-vehicle inventory needs
- Creates a clear customer response path
- Connects service customers with the sales department
Showroom TV
Showroom Displays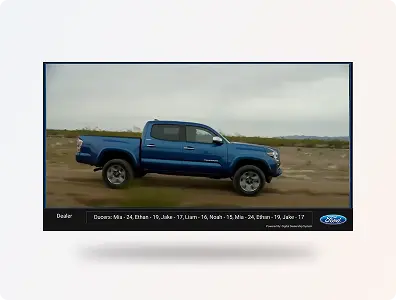
A customer-facing showroom display for featured inventory, vehicle education, promotions, finance messaging, branding, and customer experience content.
Who it is for
- Dealer principals and general managers
- Sales and marketing leaders
- Customer-experience teams
Where it belongs
- Showroom floors and entrances
- Vehicle display areas
- Sales and finance waiting areas
- Delivery areas
What dealerships can monitor
- Featured vehicles and model highlights
- Lease, finance, and trade messaging
- Reviews, awards, and community content
- Dealership branding and promotions
Business value
- Keeps showroom messaging current
- Supports sales conversations
- Promotes inventory and dealership services
- Creates a more modern and consistent showroom
Sales Appointment Display
Showroom Displays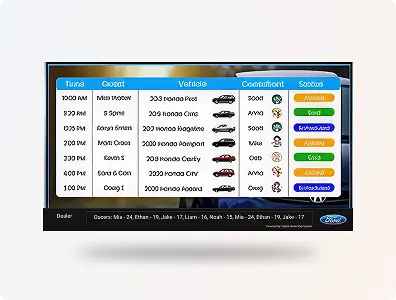
A staff-facing appointment board that keeps scheduled sales opportunities, arrival activity, and assignment information visible to the sales team.
Who it is for
- Sales managers and consultants
- BDC and internet sales teams
- Reception and appointment coordinators
Where it belongs
- Sales towers
- BDC offices
- Staff-facing showroom areas
- Sales meeting rooms
What dealerships can monitor
- Scheduled and confirmed appointments
- Customer arrivals and shows
- Salesperson assignments
- Appointment goals and activity
Business value
- Improves coordination between BDC and sales
- Keeps appointments visible throughout the day
- Helps managers prepare for arrivals
- Supports appointment accountability
Disconnected Video Wall
Video Wall Options
A budget-conscious multi-screen display in which each television operates independently rather than as one synchronized canvas.
Who it is for
- Dealerships seeking a multi-screen visual presence with simpler hardware
- Marketing and showroom teams
Where it belongs
- Showrooms
- Customer lounges
- Reception and event areas
What dealerships can monitor
- Different content on each screen
- Vehicle promotions and branded campaigns
- Live television and dealership messaging
Business value
- Creates a large visual footprint at a lower complexity
- Allows independent screen programming
- Supports varied content across one installation
Prosumer Video Wall
Video Wall Options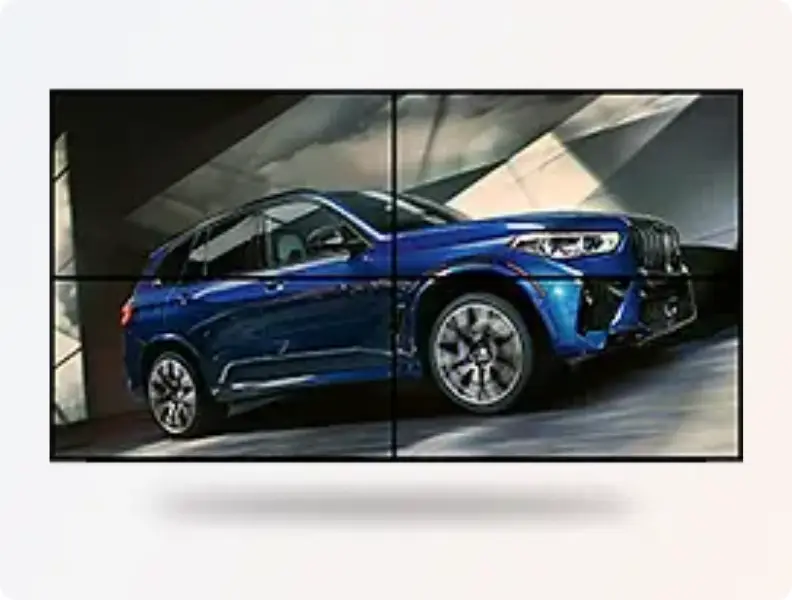
A synchronized multi-screen wall built with prosumer-grade displays and controllers for dealerships seeking a unified image without a fully commercial installation.
Who it is for
- Dealerships seeking a coordinated video wall at a midrange investment
- Marketing and customer-experience leaders
Where it belongs
- Showrooms and feature walls
- Customer lounges
- Delivery and event areas
What dealerships can monitor
- One synchronized image or campaign
- Vehicle launches and promotional video
- Brand and experiential content
Business value
- Creates a stronger visual impact than separate screens
- Provides a unified canvas at a moderate investment
- Supports premium showroom presentation
Commercial Video Wall
Video Wall Options
A premium synchronized video wall built with commercial-grade displays, narrow bezels, and hardware designed for extended operation.
Who it is for
- High-volume and premium dealerships
- Dealer groups and flagship locations
- Marketing and facility leaders
Where it belongs
- Showroom feature walls
- High-visibility lobbies
- Premium customer lounges
- Brand and delivery experience areas
What dealerships can monitor
- Large-format synchronized campaigns
- Vehicle launches and brand video
- Dealership promotions and experiential content
Business value
- Creates a high-impact focal point
- Supports extended commercial operation
- Provides cleaner alignment and narrower bezels
- Helps dealerships differentiate the physical environment
Product-by-Department Map
This map is the source of truth for where each product belongs. Do not change the audience, department, zone, or screen location unless leadership specifically approves it.
| Department / Zone | Product | Audience | Correct Screen Location | Main Benefit |
|---|---|---|---|---|
| Showroom Floor | Showroom TV Displays | Customer-facing | Showroom wall, vehicle display area, reception area, customer seating area | Promotes vehicles, offers, dealership branding, and customer-facing sales messages. |
| Showroom Floor | Commercial-Free TV | Customer-facing | Customer seating area, reception area, showroom waiting area, finance waiting area | Replaces random outside TV or commercials with dealership-controlled customer-facing content. |
| Showroom Floor | Vehicle Promotion Screens | Customer-facing | Near display vehicles, showroom walls, feature vehicle area, sales waiting area | Highlights featured models, trade-in messages, lease offers, finance offers, and dealership promotions. |
| Showroom Floor | Video Walls | Customer-facing | Main showroom, entrance, feature vehicle area, premium showroom space, EV display area | Creates a high-impact brand experience and makes the dealership feel more modern and premium. |
| Showroom / Reception Area | Welcome Board | Customer-facing | Front entrance, reception desk, showroom entry, customer greeting area | Creates a professional first impression and helps customers feel expected when they arrive. |
| Showroom / Delivery Area | Delivery Board | Customer-facing | Delivery bay, showroom delivery area, handoff area, customer celebration space | Makes vehicle delivery feel more personal, polished, and memorable. |
| Showroom / Delivery Area | Congratulations / Welcome Screen | Customer-facing | Delivery bay, showroom screen, feature wall, reception-adjacent delivery area | Creates a premium handoff moment and reinforces the dealership experience. |
| Finance / F&I Waiting Area | Finance Education Display | Customer-facing | Finance waiting area, showroom seating area, delivery waiting area | Explains protection products, warranty options, finance steps, and customer next steps in a customer-friendly way. |
| Sales Tower / Manager Desk Inside Showroom | Sales Leaderboard | Staff-only / staff-primary | Behind or inside the sales tower, manager desk, desk manager area, staff-visible wall | Keeps sales performance, goals, rankings, units, gross, and pace visible to sales staff and managers. |
| Sales Tower / Manager Desk Inside Showroom | Sales Appointment Board | Staff-only / staff-primary | Sales tower, manager desk, desk manager area, BDC-adjacent sales area | Helps managers and salespeople track appointments, showroom traffic, and upcoming customer visits. |
| Sales Tower / Manager Desk Inside Showroom | Executive Sales Dashboard | Staff-only / staff-primary | Sales tower, manager desk, GM office, sales manager office | Gives leadership a quick view of sales performance without waiting for reports. |
| Sales Tower / Sales Management Office | Sales Leaderboard | Staff-only | Sales tower, sales manager desk area, sales office, staff-only sales area | Keeps sales performance, goals, rankings, and pace visible to the team. |
| BDC Office | BDC Performance Tracker | Staff-only | BDC office, internet sales office, call center area, sales manager area | Tracks calls, appointments, set/show/sold activity, lead follow-up, and rep performance. |
| BDC Office | Appointment Tracking Display | Staff-only | BDC office, internet sales area, sales tower, manager office | Keeps appointment activity visible so teams can follow up, prepare, and stay aligned. |
| Service Drive Check-In Lane | Welcome / Check-In Board | Mixed-access | Service lane entrance, service reception entrance, check-in lane, near advisor greeting area | Helps customers feel acknowledged and gives the service arrival experience a more organized first impression. |
| Service Drive Check-In Lane | Service Appointment Board | Mixed-access | Service lane entrance, check-in lane, advisor area, service reception entrance | Displays scheduled appointments and helps advisors, porters, and customers understand service flow. |
| Service Drive Check-In Lane | Digital Service Menu Board | Mixed-access | Only if placed inside or beside service reception / advisor area; not randomly mounted in the open vehicle lane | Helps customers see service options at the start of the visit when placed near the advisor flow. |
| Advisor Write-Up Counter / Service Reception Interior | Digital Service Menu Board | Mixed-access | Advisor write-up counter, counter-height advisor desks, service reception wall, behind or beside advisor stations | Gives advisors visual support while explaining maintenance packages, service options, pricing, and recommendations. |
| Advisor Write-Up Counter / Service Reception Interior | Dare to Compare Screen | Mixed-access | Advisor counter, service reception wall, advisor area, nearby customer-facing service wall | Reinforces dealership service value compared with outside repair options and helps customers compare more than price. |
| Customer Lounge / Service Waiting Area | Customer Lounge TV | Customer-facing | Customer lounge, service waiting area, coffee area, seating area, family waiting area | Replaces random TV with dealership-controlled content, service updates, promotions, and branded messaging. |
| Customer Lounge / Service Waiting Area | Service Status Screen | Customer-facing | Customer lounge, waiting area, service waiting wall, lounge TV area | Keeps customers informed about vehicle progress and helps reduce “Where is my car?” interruptions. |
| Customer Lounge / Service Waiting Area | Wait Time Display | Customer-facing | Customer lounge, service waiting area, service reception waiting area | Helps customers understand wait expectations and makes the waiting experience feel more transparent. |
| Customer Lounge / Service Waiting Area | Service Menu Content | Customer-facing | Lounge TV, service waiting room screen, customer seating area screen | Shows service options, maintenance packages, and useful service education while customers are seated and paying attention. |
| Customer Lounge / Service Waiting Area | Maintenance Education Screens | Customer-facing | Lounge, service waiting area, coffee area, customer seating area | Helps customers understand maintenance needs, seasonal services, dealership service value, and ownership care. |
| Customer Lounge / Service Waiting Area | Commercial-Free Dealership TV | Customer-facing | Lounge TVs, waiting rooms, customer seating areas | Removes irrelevant outside commercials and turns waiting time into dealership messaging time. |
| Customer Lounge / Service Waiting Area | Service Promotion Screens | Customer-facing | Lounge TV, waiting area, customer seating area, service reception waiting area | Promotes tires, batteries, oil changes, alignments, accessories, maintenance packages, and seasonal service offers. |
| Cashier / Checkout Area | Service Status / Pickup Display | Customer-facing | Checkout counter, cashier wall, lounge exit, pickup flow area | Helps customers understand pickup status, final service steps, and checkout flow. |
| Cashier / Checkout Area | Service Promotion Screens | Customer-facing | Cashier area, checkout wall, waiting line, lounge exit | Promotes future service, tires, accessories, maintenance packages, retention offers, and seasonal campaigns. |
| Cashier / Checkout Area | Maintenance Reminder Content | Customer-facing | Checkout wall, payment counter area, lounge exit | Reminds customers about upcoming maintenance, future service needs, and dealership service value before they leave. |
| Technician Shop / Service Bays | Fixed Ops Leaderboard | Staff-only | Technician shop, service bay wall, shop pillar, shop foreman area, staff-visible service bay display | Keeps technician performance, hours, efficiency, productivity, tech rates, codes, and shop performance visible. |
| Technician Shop / Service Bays | Technician Performance Display | Staff-only | Shop floor, technician area, dispatch area, shop wall, service bay area | Helps technicians see pace, goals, hours, efficiency, productivity, and performance throughout the day. |
| Technician Shop / Service Bays | Shop Productivity Display | Staff-only | Shop wall, shop foreman station, technician work area | Makes repair activity, productivity, and service bay performance visible to the team. |
| Service Manager / Fixed Ops Office | Advisor Leaderboard | Staff-only | Service manager office, advisor back office, fixed ops office, staff-only service area | Tracks advisor performance, close rate, RO activity, revenue-related metrics, and service advisor accountability. |
| Service Manager / Fixed Ops Office | Fixed Ops Dashboard | Staff-only | Service manager office, fixed ops director office, GM office, fixed ops back office | Gives leadership visibility into service performance before the day or month is over. |
| Parts Department | Parts / Accessory Promotion Screens | Mixed-access | Parts counter, accessory display area, service lounge, showroom accessory area | Promotes accessories, parts specials, seasonal products, tires, and add-on opportunities. |
| Dealer Administrative Offices | Executive Dashboard | Staff-only | Dealer principal office, GM office, executive conference room, ownership office | Gives leadership high-level visibility into dealership performance. |
| Employee Break Room | Internal Communication Screens | Staff-only | Break room, employee hallway, training room, staff-only common area | Shares internal updates, goals, reminders, recognition, and team communication. |
| General Manager Office | Sales / Fixed Ops / BDC Dashboards | Staff-only | GM office, executive office, leadership meeting room | Gives management a quick view of dealership activity and performance across departments. |
Implementation and Launch Process
The implementation process should match the dealership’s selected products, data requirements, locations, and existing hardware. A typical project includes the following stages:
Discovery and goals
Identify the departments, audiences, screens, performance needs, and customer communication goals.
Screen and placement review
Confirm which screens are customer-facing, staff-facing, or mixed-access and determine the correct product for each location.
Integration and access planning
Confirm supported data sources, permissions, available metrics, update timing, and any multi-store requirements.
Hardware and network review
Evaluate existing displays, media players, mounting, connectivity, orientation, and operational requirements.
Configuration and design
Set up dashboards, metrics, goals, branding, content, scheduling, and screen assignments.
Testing and validation
Verify that data, content, permissions, screen placement, and audience visibility are correct.
Training and launch
Prepare dealership users to review, manage, and use the products appropriately.
Ongoing support and optimization
Review usage, refine screen assignments, update goals and content, and confirm that each display continues to serve its intended audience.
Hardware and Display Requirements
Hardware requirements vary by product, location, screen size, and dealership environment. The implementation review should confirm the following:
Whether existing televisions or commercial displays are suitable for the intended operating schedule and environment.
Whether a Digital Dealership System media player or another supported playback method is required.
Whether the screen should be horizontal, vertical, or part of a video wall.
Whether the location has reliable power, network access, mounting, ventilation, and safe visibility.
Whether one product will remain on the screen or several content types will rotate according to a schedule.
Whether the same product should appear on multiple screens or each display requires a different configuration.
Whether customer-facing screens meet privacy and readability requirements.
Data Integrations and Information Flow
Some Digital Dealership System products use dealership data integrations, while others operate primarily as managed digital-signage and communication products. Integration availability depends on the dealership’s systems, product selection, permissions, and implementation scope.
Integration partners
Digital Dealership System connects with dealership platforms used for leaderboard reporting, BDC visibility, and service-drive status communication. Availability varies by product, data permissions, and dealership configuration.
Partner availability and supported fields can differ by product and dealership. The exact integration scope should be confirmed during discovery and implementation.
Products that commonly use integrations
Sales Leaderboard and sales dashboards
Fixed Operations Leaderboard and service performance dashboards
BDC Performance Tracker
Service Status and selected appointment or pickup displays
Executive and multi-store dashboards
Products that may operate without a performance-data integration
Customer Lounge TV
Commercial-Free Dealership TV
Showroom TV Displays
Digital Service Menu Boards
Dare to Compare Screens
Welcome, delivery, promotion, education, and internal communication screens
Integration principles
Only the information needed for the approved product and display should be used.
Available fields and report definitions may vary by DMS, CRM, department, and dealership process.
Digital Dealership System configurations should use consistent metric definitions across screens and locations.
Integration scope, access, and update frequency should be confirmed during implementation.
When a dealership changes a connected system, the integration and reporting requirements should be reviewed before migration.
Management, Customization, and Permissions
Digital Dealership System should be configured around the dealership’s roles, goals, and screen locations rather than forcing every store to use the same display.
Selected metrics, goals, rankings, names, photos, branding, and layouts may be configured according to the product and available data.
Different departments and screens can receive different content or performance views.
Customer-facing and staff-facing screens should be managed as separate audiences.
Content may be scheduled or updated according to dealership campaigns and operational needs.
Multi-store organizations can use consistent standards while still supporting store-specific content where appropriate.
Access should be limited according to job role, department, location, and business need.
Sensitive performance or customer information should not appear on screens visible to unauthorized viewers.
Choosing Between Similar Products
Customer Lounge TV vs. Commercial-Free Dealership TV
Customer Lounge TV is designed specifically around the service waiting experience and may include service education, promotions, dealership messaging, and compatible status content. Commercial-Free Dealership TV is the broader concept of replacing uncontrolled programming with dealership-controlled content in customer-facing areas.
Service Status Screen vs. Wait Time Display
A Service Status Screen communicates the vehicle’s progress through service stages. A Wait Time Display communicates expected timing or general wait information. A dealership may use either product independently or combine them when the workflow supports both.
Sales Leaderboard vs. Executive Dashboard
A Sales Leaderboard is designed for ongoing team visibility, recognition, goals, rankings, and coaching. An Executive Dashboard provides a higher-level view for managers, ownership, or multi-store leadership.
Fixed Operations Leaderboard vs. Technician Performance Display
A Fixed Operations Leaderboard can include broader advisor, technician, department, and service metrics. A Technician Performance Display is focused more specifically on technician-level shop performance.
Digital Service Menu Board vs. Dare to Compare Screen
A Digital Service Menu Board presents services, packages, pricing, and maintenance information. A Dare to Compare Screen explains the value of dealership service compared with outside alternatives.
Welcome Board vs. Appointment Board
A Welcome Board focuses on the arrival experience and customer guidance. An Appointment Board focuses on scheduled visits, assignments, or appointment flow.
Showroom TV Displays vs. Video Walls
Showroom TV Displays use one or more standard screens for rotating dealership content. A Video Wall creates a larger coordinated visual installation intended to serve as a prominent architectural or brand feature.
Common Struggles Dealerships Face
| Dealership need or problem | Relevant Digital Dealership System solution |
|---|---|
| Sales managers and sales consultants cannot easily see current units, gross, rankings, goals, and pace throughout the day. | Sales Leaderboard |
| Fixed operations leaders lack a timely, shared view of advisor, technician, and department performance. | Fixed Operations Leaderboard |
| BDC calls, texts, emails, appointments, and conversions are difficult to monitor in one visible place. | BDC Performance Tracker |
| Service lounge televisions show irrelevant programming, outside commercials, or competitor advertising instead of dealership-controlled content. | Customer Lounge TV |
| Waiting customers repeatedly interrupt advisors because they cannot see the progress of their vehicles. | Service Status Screen |
| Service packages, pricing, and maintenance recommendations are presented inconsistently or rely on outdated printed materials. | Digital Service Menu Board |
| Customers compare dealership service with independent repair shops based only on price and do not clearly understand the dealership’s added value. | Dare to Compare Screen |
| Showroom televisions display generic, outdated, or disconnected content that does not support current vehicles, offers, or dealership messaging. | Showroom TV Displays |
| Customer-facing televisions expose the dealership to uncontrolled news, political content, repetitive commercials, and outside advertising. | Commercial-Free Dealership TV |
| Sales teams do not have a shared, visible view of upcoming appointments, assigned representatives, arrivals, and follow-up needs. | Sales Appointment Board |
| Service managers lack a consistent visual tool for comparing advisor activity, results, goals, and coaching opportunities. | Advisor Leaderboard |
| Technicians cannot easily see their hours, efficiency, productivity, goals, or pace while working in the shop. | Technician Performance Display |
| Shop leadership lacks a clear view of open repair orders, bay activity, aging work, and workflow constraints. | Shop Productivity Display |
| Dealership leaders must open and compare several separate reports to understand overall sales, service, and BDC performance. | Executive Dashboard |
| Dealer group leadership cannot compare rooftops consistently because each store reviews different reports or metric definitions. | Multi-Store Performance Dashboard |
| Finance managers and leadership lack a private, consolidated view of finance gross, goals, product performance, and program results. | Finance Manager Dashboard |
| Service customers arrive without clear check-in guidance, advisor assignments, or an organized welcome process. | Welcome or Check-In Board |
| Vehicle delivery feels routine and misses an opportunity to create a personalized, memorable customer handoff. | Delivery and Congratulations Board |
| Waiting customers do not understand expected service timing and may feel uninformed even when work is progressing normally. | Wait Time Display |
| Customers are unsure when their vehicle is ready or what steps to follow for payment and vehicle retrieval. | Service Pickup Display |
| Employee announcements, recognition, training reminders, and safety messages are scattered across paper notices, emails, and verbal updates. | Internal Communication Screen |
| Fixed operations leadership reviews parts and labor results separately and lacks a combined view of their contribution to department performance. | Parts and Labor Dashboard |
| The showroom lacks a high-impact visual centerpiece for launches, campaigns, brand storytelling, and premium customer experiences. | Video Wall |
Value of Digital Dealership System
Digital Dealership System products are designed to support measurable operational and customer-experience improvements. Actual results depend on the dealership’s processes, adoption, data quality, management practices, and selected products.
Potential weekly time saved
Replace recurring manual report preparation.
Fixed Ops refresh cadence
Keep service performance visible throughout the day.
Control of screen content
Replace unrelated programming with dealership messaging.
Always-visible communication
Keep approved information available on active displays.
Use Cases
The following scenarios illustrate how each Digital Dealership System product may be used in a dealership. Exact configurations, data availability, screen placement, and workflows vary by store and integration.
Sales Leaderboard
A general sales manager places a Sales Leaderboard on a staff-facing screen behind the sales tower. Sales consultants and managers can see real-time units, gross, pace, rankings, and goal progress throughout the day, while nearby showroom screens continue to display customer-facing vehicle promotions.
Fixed Operations Leaderboard
A fixed operations director installs a Fixed Operations Leaderboard on the main technician-shop wall. Advisors, technicians, and managers can monitor hours, efficiency, repair-order activity, goals, and department pace, with information typically refreshing every 15 minutes.
BDC Performance Tracker
A BDC manager displays calls, texts, emails, appointments set, show rate, sold rate, and representative rankings inside the BDC office. The team can see activity and conversion throughout the day, allowing the manager to identify follow-up gaps before opportunities are lost.
Customer Lounge TV
A dealership replaces cable news in the service lounge with Customer Lounge TV. Customers see dealership-controlled entertainment, maintenance education, seasonal offers, amenities, and community content instead of competitor advertising or unrelated commercials.
Service Status Screen
A service department places a Service Status Screen where waiting customers can view the progress of their vehicles using privacy-safe identifiers. Advisors receive fewer routine status questions, while customers have a clearer understanding of whether their vehicle is checked in, in service, awaiting approval, or ready for pickup.
Digital Service Menu Board
Digital Service Menu Boards are installed behind the advisor write-up counter to present maintenance packages, service pricing, seasonal recommendations, and current offers. Advisors use the screens as visual support while explaining service options, helping create a more consistent customer conversation.
Dare to Compare Screen
A dealership places a Dare to Compare Screen near service reception to explain the value of factory-trained technicians, OEM parts, specialized equipment, warranty-backed repairs, and dealership service history. Advisors can use the display when customers compare dealership service with an independent repair facility based only on price.
Showroom TV Displays
The sales department uses Showroom TV Displays to rotate featured inventory, lease offers, trade-in messaging, dealership awards, customer reviews, and vehicle technology content. Each screen can be assigned content appropriate to its location instead of repeating the same generic presentation throughout the showroom.
Commercial-Free Dealership TV
A dealer group replaces traditional programming in showroom seating areas, finance waiting areas, and service lounges with Commercial-Free Dealership TV. The group maintains control over the customer environment across all locations and prevents competitor ads, political programming, and inappropriate content from appearing.
Sales Appointment Board
A Sales Appointment Board is positioned inside the sales tower so managers and sales consultants can review upcoming appointments, customer arrival times, assigned representatives, and appointment progress. The team can prepare for scheduled visits and identify appointments requiring confirmation or follow-up.
Advisor Leaderboard
A service manager displays an Advisor Leaderboard in a staff-only service office. Advisors can review repair-order activity, hours per repair order, dollars per repair order, retail saturation, goal progress, and rankings, giving the manager a visible foundation for coaching and recognition.
Technician Performance Display
A Technician Performance Display is mounted near the service bays where technicians can see their hours, efficiency, productivity, goals, and pace without leaving the shop floor. Each technician receives a clearer view of personal progress while the shop foreman can identify where support may be needed.
Shop Productivity Display
A shop foreman uses a Shop Productivity Display near dispatch to monitor open repair orders, bay activity, work status, aging jobs, and overall shop pace. The display helps the team identify workflow constraints and jobs that may require reassignment or management attention.
Executive Dashboard
A general manager reviews an Executive Dashboard in the leadership office that combines selected sales, fixed operations, and BDC metrics. Instead of opening several separate reports, leadership can quickly identify which department is on pace and where immediate attention may be required.
Multi-Store Performance Dashboard
A dealer group places a Multi-Store Performance Dashboard in its corporate office to compare selected results across rooftops. Regional leaders can review store rankings, units, gross, service performance, BDC activity, and progress to goal using consistent definitions across the organization.
Finance Manager Dashboard
A Finance Manager Dashboard is displayed on a private screen inside the finance department. Finance managers and dealership leadership can review gross, goals, product performance, program results, and individual performance without exposing internal financial metrics to customers completing paperwork nearby.
Welcome or Check-In Board
A Welcome or Check-In Board is installed inside service reception and positioned so it can be seen from the arrival path. It can greet scheduled customers, show advisor assignments, provide check-in directions, and make the service arrival process feel more organized.
Delivery and Congratulations Board
A Delivery and Congratulations Board is placed in the vehicle handoff area. When a customer takes delivery, the screen can display a personalized congratulations message, vehicle image, dealership branding, ownership tips, and first-service information to make the final handoff more memorable.
Wait Time Display
A Wait Time Display is placed in the customer lounge to communicate estimated service timing and set clearer expectations. It can operate alongside a Service Status Screen, with one showing general wait information and the other showing the progress of individual vehicles.
Service Pickup Display
A Service Pickup Display near the cashier or lounge exit shows privacy-safe vehicle-ready notifications and pickup instructions. Customers can see when the next step is available, while the dealership creates a clearer transition from service completion to payment and vehicle retrieval.
Internal Communication Screen
An Internal Communication Screen in the employee break room rotates company announcements, training reminders, safety messages, birthdays, anniversaries, dealership events, and approved employee recognition. Leadership can update internal messages without relying on paper notices or scattered emails.
Parts and Labor Dashboard
A fixed operations director uses a Parts and Labor Dashboard in a staff-only office to review labor sales, parts sales, gross, goals, and department performance together. The combined view helps leadership understand how parts and service results contribute to overall fixed operations performance.
Video Wall
A dealership installs a multi-screen Video Wall in the main showroom to create a high-impact branded environment. The wall can display synchronized vehicle launches, dealership campaigns, lifestyle content, and manufacturer-approved creative while smaller screens elsewhere continue to serve more specific sales or customer-communication purposes.
Frequently Asked Questions
Does Digital Dealership System work with every dealership system?
Integration availability varies by product and dealership software. Supported systems, fields, permissions, and update timing should be confirmed during discovery.
Can a dealership use its existing televisions?
Existing screens may be used when they are suitable for the location, operating schedule, orientation, connectivity, and selected product. Hardware suitability should be reviewed during implementation.
How often does the information update?
Sales performance information may update in real time when supported. Fixed Operations information typically updates every 15 minutes. Managed content updates according to publishing and scheduling settings.
Can every screen show different content?
Yes. Screen assignments can be configured by department, audience, purpose, and location, subject to the selected product and implementation.
Can one product appear on multiple screens?
A product may be assigned to multiple approved screens when the dealership’s configuration and licensing support it.
Can multiple dealerships be managed together?
Multi-store dashboards and centrally managed content can support dealer groups, while individual stores may retain location-specific screens and messaging.
Can reports be customized?
Available metrics, goals, layouts, branding, and report options vary by product and integration. The dealership’s required view should be defined during configuration.
Which products are customer-facing?
Customer Lounge TV, Service Status, Wait Time, Digital Service Menu Boards, Dare to Compare, Showroom TV Displays, welcome screens, delivery screens, and other approved communication products are designed for customer-facing environments.
Which products are staff-facing?
Sales, Fixed Operations, BDC, technician, advisor, finance, executive, and multi-store performance products are intended primarily for authorized dealership employees and leadership.
How is private information protected on public screens?
Customer-facing screens should use approved information formats, restricted fields, proper placement, and audience-specific configurations. Internal performance data should remain on staff-facing screens.
Does Digital Dealership System replace the dealership’s DMS or CRM?
No. Connected products use approved information from dealership systems to improve visibility; they do not replace the dealership’s primary operating platforms.
What happens after launch?
The dealership may receive ongoing support, content updates, configuration assistance, and optimization according to its selected solution and service arrangement.
Automotive Specialization and Ongoing Support
Digital Dealership System is designed specifically around dealership departments, roles, screens, workflows, and performance needs. The platform distinguishes between customer communication and staff performance rather than treating every dealership television as the same type of digital sign.
Support requirements vary by solution, but may include implementation guidance, hardware coordination, integration assistance, screen configuration, content management, training, troubleshooting, and ongoing optimization. The dealership should confirm the exact support scope, responsibilities, response expectations, and included services before launch.
Glossary
% Active
The percentage of leads from a specific source that are currently being worked and have not yet been marked sold or lost. A common calculation is: Active leads from the source ÷ Total leads from the source × 100
% Appointment Shown
See % AS.
% AS — Appointment Shown Percentage
The percentage of scheduled appointments that resulted in the customer physically arriving at the dealership. A common calculation is: Appointments shown ÷ Appointments scheduled × 100 This metric may also be referred to as Show Rate.
% Bad
The percentage of leads from a specific source that are classified as invalid, duplicate, unreachable, incorrect, or otherwise unworkable. A common calculation is: Bad leads from the source ÷ Total leads from the source × 100 The dealership should clearly define which lead statuses qualify as Bad.
% Close — Closing Percentage
The percentage of qualifying customer appointments or opportunities that resulted in a completed sale. A common appointment-based calculation is: Completed sales ÷ Appointments shown × 100 The dealership should identify whether the calculation is based on appointments set, appointments shown, showroom opportunities, write-ups, or another qualifying population.
% Lost
The percentage of leads from a specific source that did not convert and were marked lost. A common calculation is: Lost leads from the source ÷ Total leads from the source × 100
% Sold
The percentage of leads from a specific source that resulted in a completed sale. A common calculation is: Sold leads from the source ÷ Total leads from the source × 100
% to Goal
The percentage of an established target that has been achieved. A common calculation is: Current result ÷ Goal × 100 A result below 100% indicates the goal has not yet been reached. A result of 100% indicates the goal has been met. A result above 100% indicates the goal has been exceeded.
% Total
The percentage of all dealership leads that came from a specific lead source. A common calculation is: Leads from the source ÷ Total dealership leads × 100 This metric helps dealership leadership understand how much of the overall lead volume is generated by each source.
% Trade — Trade-In Percentage
The percentage of completed vehicle sales that included a customer trade-in. A common calculation is: Sold deals with a trade ÷ Total sold deals × 100
% WA — Walk-Around Percentage
The percentage of qualifying customer visits or vehicle presentations in which a proper vehicle walk-around was completed. A common calculation is: Completed walk-arounds ÷ Qualifying customer visits or demonstrations × 100 The dealership should define what activity qualifies as a completed walk-around.
% WU — Write-Up Percentage
The percentage of qualifying customer demonstrations or sales opportunities that were formally documented as write-ups in the dealership’s system. A common calculation is: Completed write-ups ÷ Qualifying demonstrations or opportunities × 100
A
90 Av — 90-Day Average
The average performance for a selected metric over the previous 90 days. A 90-Day Average helps leadership evaluate performance over a longer period and reduces the effect of unusually strong or weak individual days.
ACV — Actual Cash Value
The dealership’s assessed market value of a customer’s trade-in vehicle before loan payoff, customer equity, negative equity, or trade allowance is applied. ACV is different from the amount shown to the customer as a trade allowance.
Advisor Efficiency
A dealership-defined measurement of how effectively a service advisor converts repair-order opportunities into labor hours, service revenue, or gross profit. The exact calculation may differ by dealership. Advisor Efficiency may consider metrics such as: Hours sold per repair order Dollars per repair order Average sales per repair order Average gross per repair order Recommended-service close rate Retail saturation The calculation should be clearly defined before comparing advisors.
Aging
The length of time that a vehicle has remained in inventory or that a repair order has remained open. Vehicle Aging is typically measured from the date a vehicle enters inventory. Repair Order Aging is typically measured from the date the repair order is opened. Older inventory or repair orders may require additional management attention.
AGM — Average Gross Margin
The average gross profit earned per qualifying vehicle deal, repair order, or transaction. A common calculation is: Total gross profit ÷ Number of qualifying transactions The dealership should identify whether AGM refers to gross dollars, gross percentage, vehicle deals, repair orders, or another transaction type.
APT Goal — Appointment Goal
The target number of customer appointments expected to be set, confirmed, shown, or completed during a defined reporting period. Reports should clearly state which appointment stage the goal measures.
Appt % — Appointment Percentage
The percentage of qualifying customer interactions or leads that result in a scheduled appointment. A common calculation is: Appointments set ÷ Qualifying customer interactions or leads × 100 This metric may also be referred to as Set Rate.
AV — Average
A calculated mean used to represent typical performance for a metric during a defined period. A common calculation is: Total value ÷ Number of qualifying records
AV GRO/RO — Average Gross per Repair Order
The average gross profit generated by each qualifying repair order. A common calculation is: Total qualifying gross profit ÷ Qualifying repair orders The report should identify whether the gross includes labor, parts, customer-pay work, warranty work, internal work, or all repair orders.
AV Sales/RO — Average Sales per Repair Order
The average total revenue generated by each qualifying repair order. A common calculation is: Total qualifying service sales ÷ Qualifying repair orders The dealership should identify which sales categories and repair-order types are included.
B
BE — Back-End Gross
The gross profit generated primarily through the Finance and Insurance department after the vehicle selling price has been established. Back-End Gross may include profit from: Finance reserve Vehicle service contracts Guaranteed asset protection Maintenance plans Tire and wheel protection Appearance protection Other finance and aftermarket products See also Back-End Gross.
Brands
The vehicle manufacturers, franchises, or vehicle makes represented in a dealership’s inventory or sales reporting. Brand reporting may be used to compare: Units sold Gross Inventory Lead activity Salesperson performance Model performance
C
Car Icon — Solid
A solid car icon represents a new vehicle.
Car Icon — Hollow
A hollow car icon represents a used vehicle.
Car Icon — With Dot
A car icon containing a dot represents a financed vehicle transaction.
Car Icon — Without Dot
A car icon without a dot represents a delivered vehicle. The exact icon rules should remain consistent across all reports so employees can interpret them correctly.
Cash Value
The monetary value assigned to a vehicle or transaction without including financing terms. In trade reporting, Cash Value may refer to the vehicle’s assessed value before loan payoff, equity, or financing adjustments. Where applicable, the report should distinguish Cash Value from Actual Cash Value, trade allowance, and selling price.
CSI — Customer Satisfaction Index
A score used by a manufacturer, dealership, or third-party provider to measure customer satisfaction with the sales or service experience. CSI may evaluate: Communication Employee professionalism Timeliness Facility experience Vehicle delivery Service quality Overall satisfaction Likelihood to recommend
D
Deal Type
The classification assigned to a vehicle transaction. Common Deal Types include: Cash Finance Lease Retail Fleet Wholesale New vehicle Used vehicle Employee Dealer trade
Demos
Vehicles shown, presented, or driven by customers as part of the dealership sales process. A demonstration may include: A vehicle presentation A feature review A vehicle walk-around A test drive Dealerships may compare Demos with Walk-Arounds, Write-Ups, and completed sales to evaluate process completion.
$/RO — Dollars per Repair Order
The average revenue generated by each qualifying repair order. A common calculation is: Total qualifying revenue ÷ Qualifying repair orders The dealership should identify whether the calculation includes labor, parts, customer-pay work, warranty work, internal work, or all service revenue.
E
ELR — Effective Labor Rate
The average labor revenue generated for each labor hour sold. A common calculation is: Labor sales ÷ Labor hours sold ELR may be influenced by labor pricing, discounts, work mix, warranty rates, internal rates, and advisor selling practices.
F
FE — Front-End Gross
The gross profit generated directly from the vehicle transaction before Finance and Insurance income is included. Front-End Gross is generally based on the difference between the vehicle’s selling price and the dealership’s recognized cost, subject to dealership accounting practices. See also Front-End Gross.
G
Gross
The profit generated by a sale, repair, department, or other transaction after the applicable direct costs are deducted from revenue. Depending on the report, Gross may refer to: Front-End Gross Back-End Gross Total Gross Labor Gross Parts Gross Service Gross The report should clearly identify which type of Gross is being displayed.
H
HGM — Hourly Gross Margin
The amount of gross profit generated per labor hour sold in the service department. A common calculation is: Labor gross profit ÷ Labor hours sold The dealership should confirm whether this metric includes labor only or a combination of labor and parts gross.
Hours Pace Goal
The projected number of labor hours expected to be sold by the end of the reporting period based on current performance and the dealership’s established goal. This metric may compare: Current hours sold Required daily pace Projected month-end hours Monthly hours goal
HR/RO — Hours per Repair Order
The average number of labor hours billed or sold on each qualifying repair order. A common calculation is: Total labor hours ÷ Qualifying repair orders
HRS/RO — Hours Sold per Repair Order
A measurement of how much labor work is sold during each qualifying customer visit. A common calculation is: Total hours sold ÷ Repair-order count HR/RO and HRS/RO may be used interchangeably by some dealerships. Reports should use one consistent label and calculation.
I
Inbound
Customer-initiated communications received by the dealership. Inbound activity may include: Phone calls Text messages Emails Chats Website forms Digital leads Social media inquiries
Inbound % VS Total — Inbound Versus Total Percentage
A comparative percentage showing an individual employee’s inbound communication contribution relative to the dealership’s total inbound volume. A common calculation is: Individual inbound calls, texts, and emails ÷ Total dealership inbound calls, texts, and emails × 100 The report should identify which communication channels and departments are included.
L
Leads
Customer inquiries or potential sales or service opportunities received by the dealership. Lead sources may include: Dealership website Manufacturer website Third-party automotive websites Phone calls Walk-ins Chat Text Email Social media Advertising campaigns Referrals
LM — Last Month
Performance recorded during the previous completed calendar month. LM reporting is commonly used to compare current Month-to-Date results with the prior month.
M
Month
The selected calendar month used as the reporting period.
M-Pace — Monthly Pace
The projected number of vehicles a salesperson, department, or dealership is expected to sell by the end of the current month based on Month-to-Date performance. The projection may consider: Units sold so far Selling days completed Selling days remaining Current daily average Monthly Pace is an estimate and will change as performance changes.
MP/AM — Monthly Pace Versus Average Monthly
A comparison between a salesperson’s current projected monthly unit pace and that salesperson’s historical average monthly unit performance. This comparison indicates whether the salesperson is currently trending above, at, or below normal unit production.
MT/AM — Monthly Total Versus Average Monthly
A comparison between the current month’s total gross performance and the salesperson’s historical average monthly gross. This comparison indicates whether current gross performance is trending above, at, or below the employee’s typical monthly result.
MTD — Month-to-Date
Performance accumulated from the first day of the current month through the current date. MTD reporting may include: Units Gross Repair orders Labor sales Hours sold Appointments Leads Customer satisfaction
O
Outbound
Dealer-initiated communications sent to customers or prospects. Outbound activity may include: Follow-up phone calls Text messages Emails Appointment confirmations Lead responses Service reminders Retention campaigns
Outbound % VS Total — Outbound Versus Total Percentage
A comparative percentage showing an individual employee’s outbound communication contribution relative to the dealership’s total outbound volume. A common calculation is: Individual outbound calls, texts, and emails ÷ Total dealership outbound calls, texts, and emails × 100 The report should identify which communication channels and departments are included.
P
P&L — Parts and Labor
A fixed operations performance view summarizing revenue, cost, and gross profit generated by parts sales and labor operations. In traditional accounting, P&L commonly means Profit and Loss. When Digital Dealership System uses P&L to mean Parts and Labor, the report should label it clearly to prevent confusion.
Pace
A projection of future performance based on current activity, elapsed time, and recent results. Pace may be calculated for: Units Gross Appointments Repair orders Hours sold Revenue Other performance goals Pace is an estimate and not a guaranteed final result.
Payoff
The remaining balance owed to a lender on a customer’s existing vehicle loan. A payoff may affect: Trade equity Negative equity Deal structure Financing Customer cash requirements
R
Retail Saturation
The percentage of qualifying repair orders on which a specific recommended retail service was sold. Retail service categories may include: Tires Brakes Alignments Batteries Fluid services Maintenance flushes Other dealership-selected services A common calculation is: Repair orders containing the selected retail service ÷ Qualifying repair orders × 100 The qualifying repair-order population and selected service categories should be clearly defined.
RO — Repair Order
The official service document used to record vehicle maintenance, diagnosis, repairs, labor, parts, recommendations, approvals, and charges. See also Repair Order.
ROs MTD — Repair Orders Month-to-Date
The total number of qualifying repair orders written from the beginning of the current month through the current date. The report should identify whether it includes: Customer-pay repair orders Warranty repair orders Internal repair orders All repair-order types
S
Show Rate
The percentage of scheduled appointments that resulted in the customer arriving at the dealership. A common calculation is: Appointments shown ÷ Appointments set × 100 See also % AS — Appointment Shown Percentage.
Stock
A vehicle currently held in dealership inventory. Stock reporting may include: Stock number New or used classification Brand Model Age Cost Location Availability status
T
Tech Efficiency
A measure comparing the labor hours a technician produces with the actual time spent working. A common calculation is: Produced or flagged hours ÷ Actual working hours × 100 Tech Efficiency should be reviewed alongside quality, comebacks, available work, and repair complexity.
TGM — Total Gross Margin
The combined gross profit generated from Front-End Gross and Back-End Gross. A common calculation is: Front-End Gross + Back-End Gross Although the abbreviation includes the word Margin, this metric may represent gross dollars rather than a percentage. The report should clearly identify the unit of measurement.
TP — Total Profit
The overall profit generated during a defined reporting period after the applicable costs or expenses included in the report are deducted. Because Total Profit may be calculated differently across reports, the displayed calculation should clearly identify what revenue, costs, and expenses are included.
Trade
A customer-owned vehicle offered as part of the purchase or lease of another vehicle. Trade reporting may include: Actual Cash Value Trade allowance Payoff Equity Negative equity Brand Model Age Mileage Retail or wholesale disposition
U
Units
The total number of qualifying vehicles sold or other items completed during a reporting period. In vehicle sales, Units normally refers to vehicles sold or delivered. In fixed operations, a report may use Units to refer to completed services, retail service categories, tires, alignments, batteries, or other selected items. The report should clearly identify what each Unit represents.
V
VIN — Vehicle Identification Number
A unique 17-character identifier assigned to a vehicle. The VIN identifies information such as: Manufacturer Vehicle type Model Engine or equipment details Production sequence
W
Walk-Arounds
Structured vehicle presentations performed by dealership employees to show a customer the vehicle’s features, benefits, technology, condition, and relevant options. Walk-Around activity may be tracked to measure adherence to the dealership’s sales process.
Write-Ups
The process of formally documenting a customer, vehicle, opportunity, or proposed transaction in the dealership’s system. A sales write-up may include: Customer information Vehicle of interest Trade information Pricing Payment options Deal structure Manager involvement Write-Up Percentage may be used to measure how consistently demonstrations or customer opportunities progress to this stage.
Y
Y-Pace — Yearly Pace
The projected year-end result based on current Year-to-Date performance. Yearly Pace may be calculated for: Units Gross Repair orders Labor sales Hours sold Appointments Other annual goals The projection may change throughout the year as performance changes.
YTD — Year-to-Date
Performance accumulated from the beginning of the current calendar or fiscal year through the current date. YTD reporting may include: Units Gross Revenue Repair orders Labor sales Hours sold Appointments Customer satisfaction
Security and Privacy Principles
Screen placement and digital access are both part of protecting dealership information. A correct implementation should apply the following principles:
Use only the information required for the approved product and business purpose.
Keep employee rankings, gross, goals, and operational data on staff-facing screens.
Display customer service status in a dealership-approved format that avoids unnecessary personal information.
Limit dashboard and management access to authorized users.
Remove or update access when an employee’s role or employment status changes.
Review customer-facing screens from normal viewing positions to confirm that private information is not exposed.
Confirm integration permissions, data handling, and security responsibilities during implementation.
