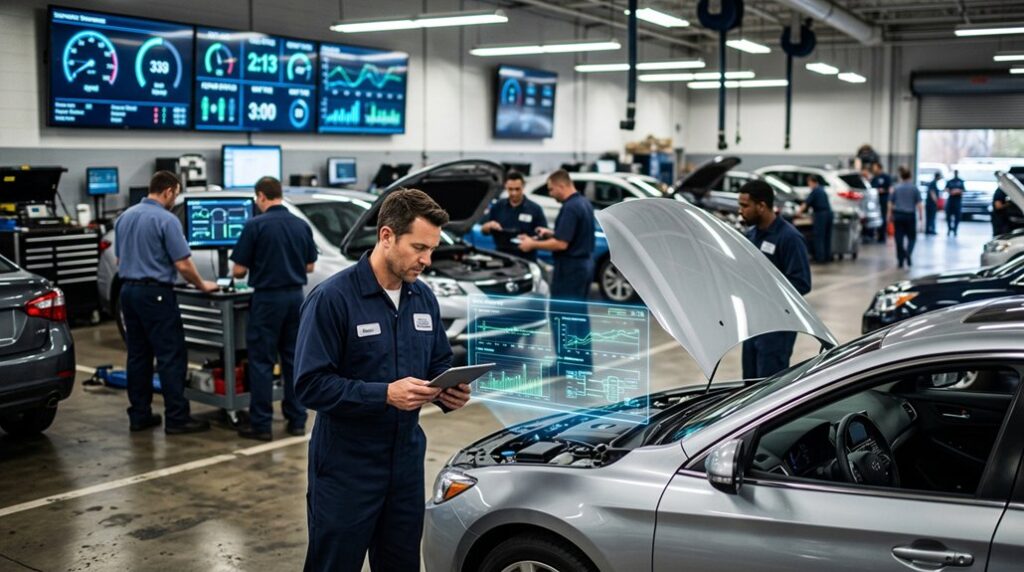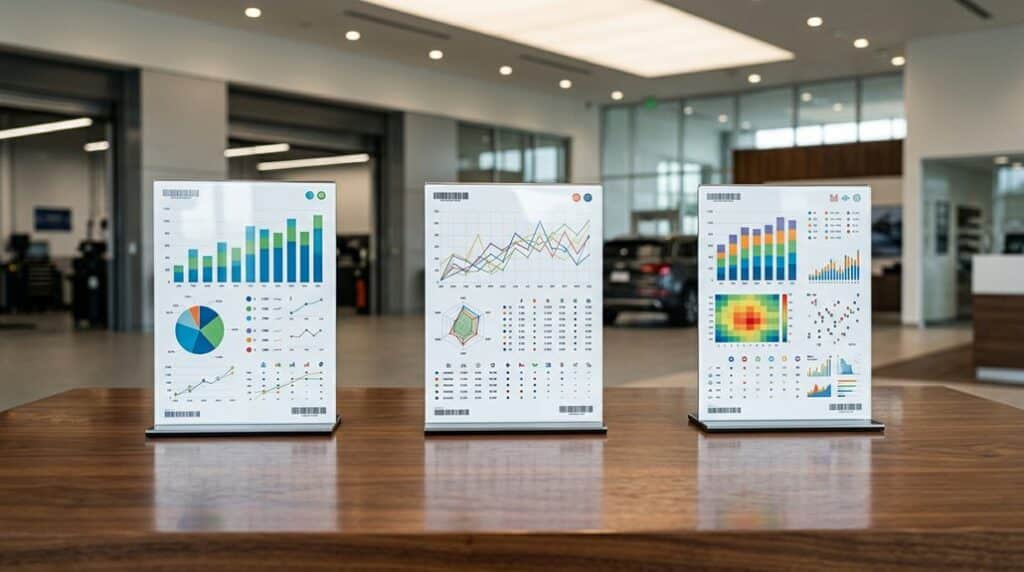

You get real-time clarity on advisor and technician performance, so you can spot gaps in efficiency, ELR, ROs, and CSI and act fast to hit targets. Live leaderboards refresh every 15 minutes, showing individual hours worked, sold, RO counts, and CSI for immediate trend spotting. That transparency fosters accountability, friendly competition, and targeted coaching. Managers can use the data for smarter scheduling, retention, and daily coaching routines — keep going to learn practical setup and success metrics.
Key Takeaways
- Live leaderboards refresh every 15 minutes to show current ROs, ELR, hours worked, and CSI for immediate status awareness.
- Individual sales and technician efficiency metrics reveal real-time performance gaps and opportunities for rapid corrective action.
- Transparent standings foster accountability and friendly competition, motivating team members to meet or exceed targets.
- Real-time alerts and trend visibility enable targeted coaching and schedule adjustments aligned with demand.
- Weekly KPI tracking plus daily checks after launch ensures data reliability and measures progress toward RO, ELR, and CSI goals.
How Fixed Ops Leaderboards Show Live Advisor & Tech Performance
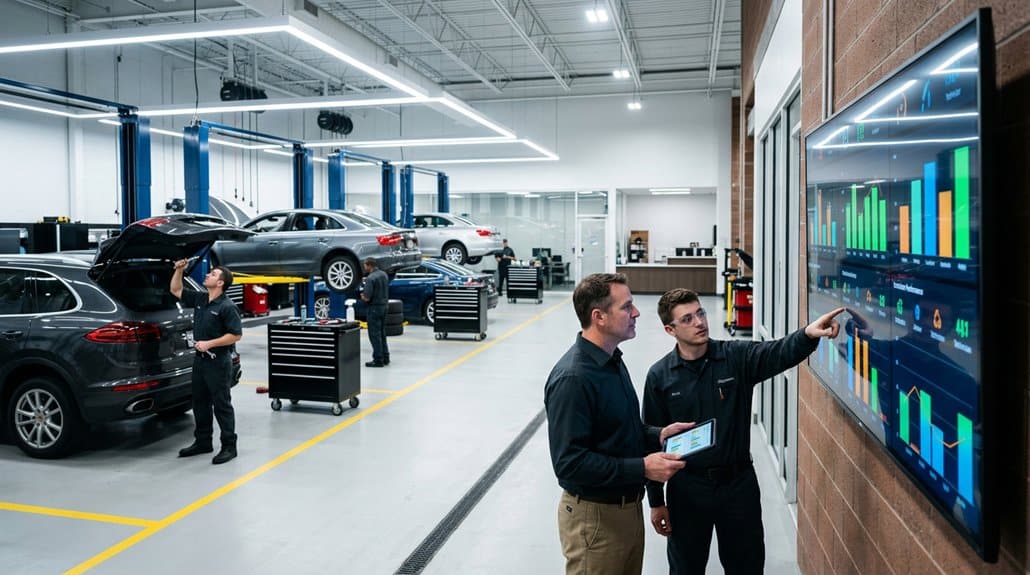
When Fixed Ops Leaderboards tap into DMS-connected reports and refresh every 15 minutes, you get real-time visibility into advisors’ and technicians’ KPIs—ROs, effective labor rates, hours worked and CSI—so teams can see exactly where they stand against goals. You’ll use advisor visibility to monitor individual sales, hours and CSI, spotting trends and coaching opportunities immediately. Technicians get live efficiency metrics that drive technician engagement through friendly competition and clear improvement paths. KPI cards on displays make performance transparent, so you and your team collaborate on priorities, redistribute workload, and target gaps. With data updating continuously, decisions become measurable and timely, producing faster gains in productivity, accountability and customer satisfaction across fixed operations.
Key KPIs on Fixed Ops Leaderboards (Efficiency, ELR, ROs, CSI)
Now that you can see live advisor and technician activity minute-by-minute, the next step is focusing on the specific KPIs that drive performance: Efficiency, Effective Labor Rate (ELR), Repair Orders (ROs), and Customer Satisfaction Index (CSI). You’ll use KPI importance to prioritize actions: Efficiency shows where productivity insights can close gaps between hours worked and hours sold, while ELR highlights opportunities for revenue optimization per labor hour. ROs provide a clear productivity baseline tied to throughput and staffing decisions, and CSI delivers direct customer feedback to guide service improvements. Together these metrics create performance benchmarks you can track in real time, enabling collaborative problem-solving, targeted coaching, and measurable gains in productivity and profitability.
How Leaderboards Drive Accountability, Competition, and Motivation
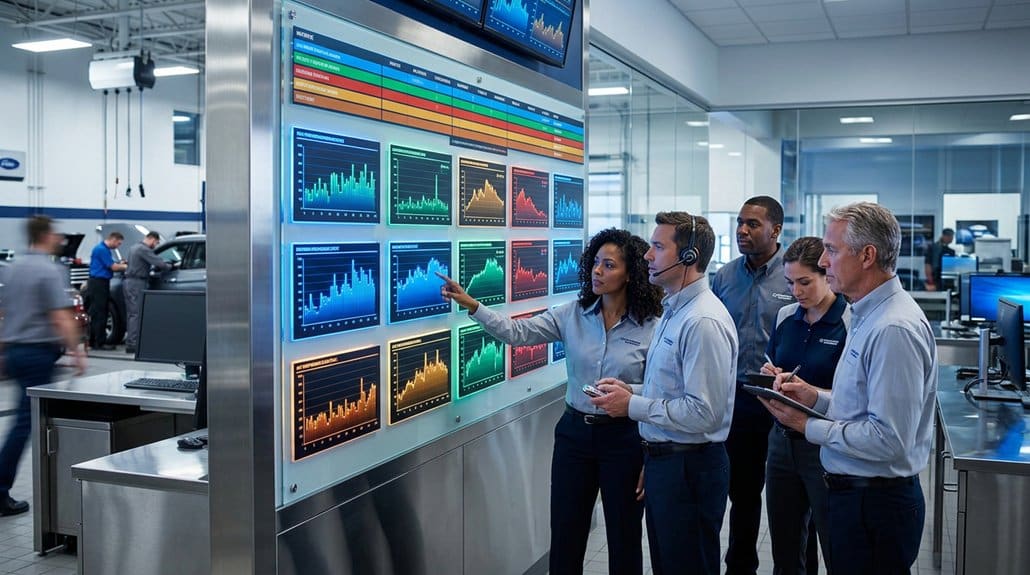
Because leaderboards update every 15 minutes and display individual and team metrics in real time, you’ll get immediate, data-backed visibility into who’s meeting targets and where gaps exist—driving accountability through transparent performance signals, sparking friendly competition that raises productivity, and creating measurable motivation by linking recognition to concrete outcomes like higher ELR, more ROs, and improved CSI. You’ll see clear performance trends that let team members self-correct quickly, while public standings encourage ownership and peer-driven improvement. This fuels positive team dynamics: advisors and techs push each other toward measurable goals, share best practices, and celebrate gains. With rapid feedback loops and visible results, motivation becomes action-oriented—focused on lifting KPIs, boosting customer satisfaction, and increasing dealership profitability through sustained behavioral change.
How Managers Turn Leaderboard Data Into Coaching, Scheduling, and Retention Actions
Leverage real-time leaderboard data to coach, schedule, and retain your Fixed Ops team with precision: spot underperformers by Tech Efficiency or ELR, deliver targeted coaching tied to specific metric gaps, and realign schedules so high-performing techs cover peak demand while developing others during slower periods.
| Action | Outcome |
|---|---|
| Targeted coaching techniques | Close specific skill gaps |
| Scheduling strategies | Align capacity with demand |
| Performance feedback cadence | Drive continuous improvement |
| Retention initiatives | Reward and retain top talent |
| Development plans | Build bench strength |
You’ll use leaderboard trends to deliver concise performance feedback, run focused coaching sessions, adjust schedules for peak coverage, and launch retention initiatives that reward measurable results. That collaborative, data-driven approach improves productivity and employee engagement.
Quick Implementation Checklist + Success Metrics to Track After Launch

When you connect the leaderboard to your DMS, configure customized metrics, and train staff on the dashboard, you’ll be ready for a fast, measurable rollout that drives technician efficiency, ELR, CSI, and service revenue improvements; track those KPIs weekly, set clear RO and sales targets for advisors and techs, and use the leaderboard’s 15-minute updates to spot trends, celebrate top performers, and course-correct in real time. Your implementation steps should be: 1) integrate with DMS and verify data feeds, 2) define customized metrics aligned to business goals, 3) establish targets for RO counts, ELR, and sales, 4) run staff training and simulate dashboards, 5) go live with daily checks. Track metrics weekly, use real-time alerts, and tie outcomes to coaching and incentives.
Frequently Asked Questions
What Are Fixed Ops at a Dealership?
Fixed ops are your dealership’s service departments handling maintenance and repairs; they drive customer satisfaction through repair efficiency, leverage technician training to boost KPIs, and collaborate data-driven to increase retention, revenue, and measurable operational results.
Conclusion
You’ve seen how live fixed‑ops leaderboards turn real‑time KPIs into measurable gains in efficiency, ELR, ROs and CSI—so what will you do with that clarity? Use the data to set targets, coach technicians and advisors, optimize schedules and reduce retention risk. When teams see daily progress, accountability and healthy competition follow, driving measurable uptime and revenue lifts. Start with a simple rollout, track adoption and ROI, and iterate based on results.