You’ll turn raw DMS service data into daily motivation by using real-time leaderboards that update every 15 minutes and translate KPIs—Customer Pay RO Count, AROV, CSI, ELR—into specific daily targets. Visible rankings create friendly accountability, flag coaching opportunities, and guide corrective actions with concise trend reports. Mobile and TV integration keeps teams focused on throughput and revenue while tracking ROI from increased AROV and retention. Keep going to uncover practical setup and coaching tactics that drive results.
Key Takeaways
- Deliver near real-time performance updates (every 15 minutes) to keep staff focused on current goals.
- Convert KPIs like Customer Pay RO Count, AROV, and CSI into clear daily targets for each team member.
- Display visible rankings and trend bars to foster friendly competition and immediate accountability.
- Trigger real-time alerts and micro-coaching opportunities to correct shortfalls quickly.
- Integrate leaderboards on TVs and mobile devices to sustain engagement and reinforce performance behaviors.
How DMS Fixed Ops Leaderboards Drive Daily Motivation

A DMS Fixed Ops leaderboard keeps you and your team focused by delivering near real-time performance data—updated every 15 minutes—so service advisors and technicians can act on gaps and wins immediately. You’ll use engagement strategies that highlight Customer Pay RO Count, AROV and CSI, turning metrics into clear targets. Motivation techniques come from visible rankings and mobile access, so staff see progress and respond fast. Performance insights are surfaced through customizable reports that reveal trends and skill gaps, enabling targeted coaching. You’ll leverage team dynamics by comparing standings, fostering constructive competition while aligning incentives to shared goals. The result is measurable uplift in productivity and accountability, with continuous feedback loops that drive daily improvement.
Pick KPIs That Drive Advisor and Tech Impact
Start by choosing a tight set of KPIs that directly link advisor and technician actions to revenue, productivity, and retention—Customer Pay RO Count and AROV for revenue focus, CSI for advisor-driven experience, ELR and OP-Code Saturation to measure technician efficiency, plus Appointment Adherence and No-Show Rate to protect throughput. You’ll use KPI Selection to create an analytical framework where Revenue Tracking and Performance Metrics tie daily tasks to measurable outcomes. Advisor Engagement improves when Service Opportunities and Repair Order Mix are visible and rewarded. Technician Productivity rises in a Competitive Environment that’s transparent and fair. Emphasize Customer Focus to protect retention while using Motivation Strategies that promote Team Accountability. The result: sharper decisions, predictable revenue, and measurable gains in shop efficiency.
Convert KPIs Into Daily Targets Your Team Can Hit

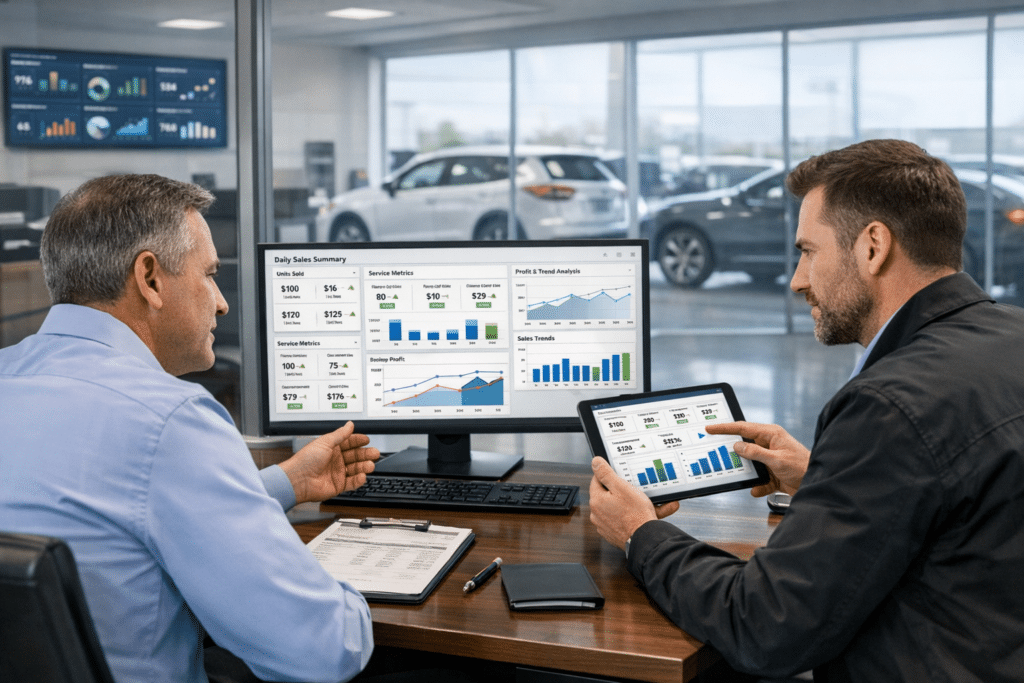
You’ll turn those KPIs into daily actionable targets by breaking monthly goals into specific, measurable tasks each team member can own. With leaderboards updating every 15 minutes, you’ll track real-time progress and course-correct before issues compound. That combination of clear daily targets and live feedback drives accountability and consistent gains in RO count, ELR, and CSI.
Daily Actionable Targets
Translate your KPIs into specific, attainable daily targets so your team knows exactly what to hit each shift. You’ll convert complex KPIs like Customer Pay RO Count and AROV into clear daily metrics and performance benchmarks that service advisors and techs can pursue. Set measurable goals for ELR, OP-Code Saturation, and CSI so staff can prioritize work that moves the needle. Daily performance reports should pinpoint shortfalls and prescribe corrective actions, not vague objectives. With targets tied to leaderboard-visible outcomes, you create accountability and healthy competition that drives improvement. Keep targets tight, trackable, and aligned to operational capacity so each shift can reliably hit goals, lift productivity, and sustain upward trends without overwhelming the team.
Real-Time Progress Tracking
When real-time DMS Fixed Ops leaderboards feed 15-minute updates on metrics like Customer Pay RO Count, AROV and ELR, you can convert those KPIs into precise daily targets that every advisor and technician can act on during their shift. You’ll use performance metrics to break a day into measurable objectives, turning broad goals into shift-level tasks. The leaderboard’s visibility supports accountability, immediate coaching, and targeted engagement strategies that improve consistency and revenue.
- Set rolling targets for RO Count by shift segment.
- Tie AROV goals to upsell prompts and technician assignments.
- Monitor ELR to optimize labor distribution in real time.
- Flag deviations instantly for focused coaching and correction.
This drives measurable, repeatable gains.
Spot Coaching Opportunities With Live Leaderboards
With live leaderboards you’ll get real-time performance alerts that flag issues the moment they affect daily KPIs. Use those alerts to design targeted skill interventions that fix specific gaps in Appointment Adherence, No-Show Rate, or ELR. Then run focused micro-coaching sprint sessions to correct behavior quickly and measure the impact on output.
Real-Time Performance Alerts
Because the leaderboard refreshes every 15 minutes, you’ll get immediate, actionable alerts that pinpoint which service advisors or technicians need spot coaching, letting managers intervene before small issues become bigger problems. You’ll receive real time feedback and performance insights that turn raw KPIs into purposeful actions. Live tracking of CSI and ELR highlights gaps and wins, so you can correct course or recognize achievement instantly. This drives accountability and sustained improvement without waiting for weekly reports.
- Identify underperforming advisors the moment trends emerge.
- Trigger focused coaching conversations tied to specific KPI dips.
- Celebrate real-time wins to reinforce desired behaviors.
- Maintain competitive momentum through visible, continuous measurement.
Targeted Skill Interventions
Real-time alerts show you where issues are forming; targeted skill interventions use that visibility to convert moments of underperformance into focused coaching opportunities. You’ll leverage live leaderboards for immediate skill gap analysis, isolating deficits in CSI or ELR and assigning corrective actions tied to measurable outcomes. By coupling leaderboard rankings with DMS data, you create a competitive yet constructive environment where coaching is timely and evidence-based. You’ll perform rapid assessments, deliver concise guidance, and track post-intervention metrics to confirm performance enhancement. This approach shifts coaching from periodic to perpetual, increasing accountability and learning velocity. Ultimately, you’ll turn transient dips into actionable development plans, ensuring sustained gains in technician and advisor productivity.
Micro-Coaching Sprint Sessions
When you spot a dip on the live leaderboard, a micro-coaching sprint lets you address the gap immediately with focused, measurable instruction; you use live DMS data to diagnose issues, deliver concise micro coaching techniques, and track improvement. You’ll apply performance feedback tied to KPIs like ELR and CSI, keeping sessions short, specific, and outcome-oriented. Benefits are immediate and measurable:
- Rapid identification of performance gaps via live leaderboard metrics.
- Targeted coaching moments with actionable steps and timelines.
- Visible accountability as team members watch rankings adjust in real time.
- Alignment of individual actions with dealership profitability and efficiency goals.
Strategically, these sprints convert data into behavior change, raising consistency, morale, and measurable service results.
Design Fixed Ops Leaderboard Displays That Get Noticed
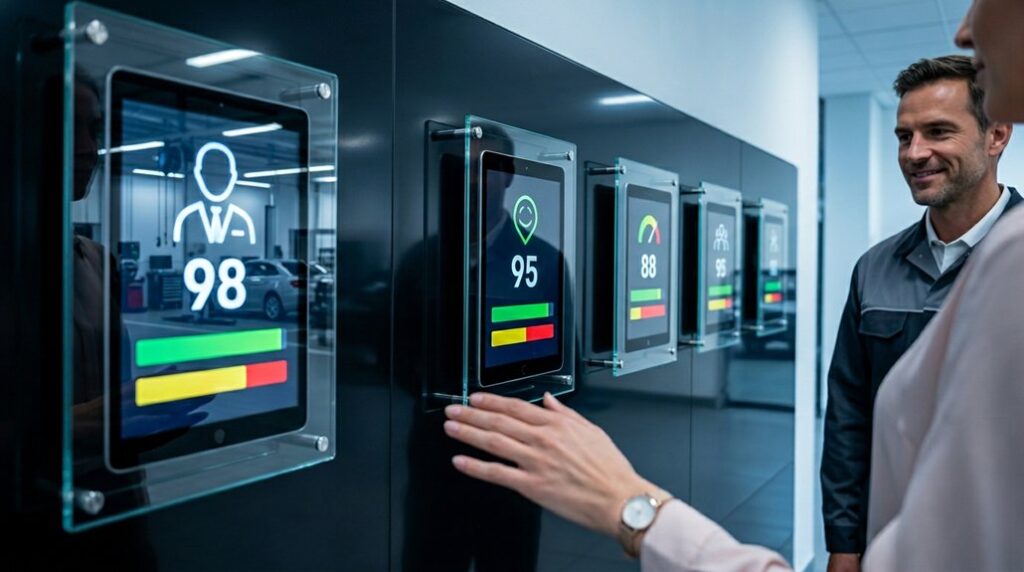
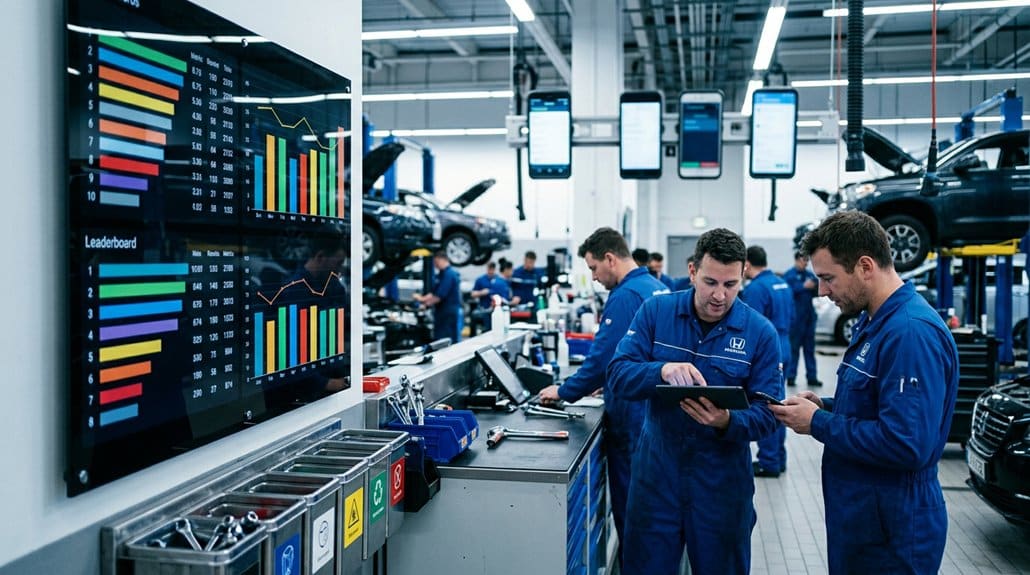
If you want your Fixed Ops leaderboard to actually move the needle, design it around a few high-impact KPIs—Customer Pay RO Count, Effective Labor Rate, AROV and CSI—then surface them with clear rankings and growth trends that spark friendly competition. You’ll prioritize visual appeal and engaging design: bold rankings, concise trend bars, and dynamic content updated every 15 minutes so performance feels immediate. Use strategic placement and attention grabbing screens where teams congregate, pairing color psychology with branding elements to reinforce priorities. Include interactive features and a user friendly interface so staff can drill into metrics during micro-coaching. Keep motivational messages aligned with goals to sustain momentum. The result is a results-driven display that converts service data into daily accountability.
Mobile & TV Integration for Fixed Ops Leaderboards

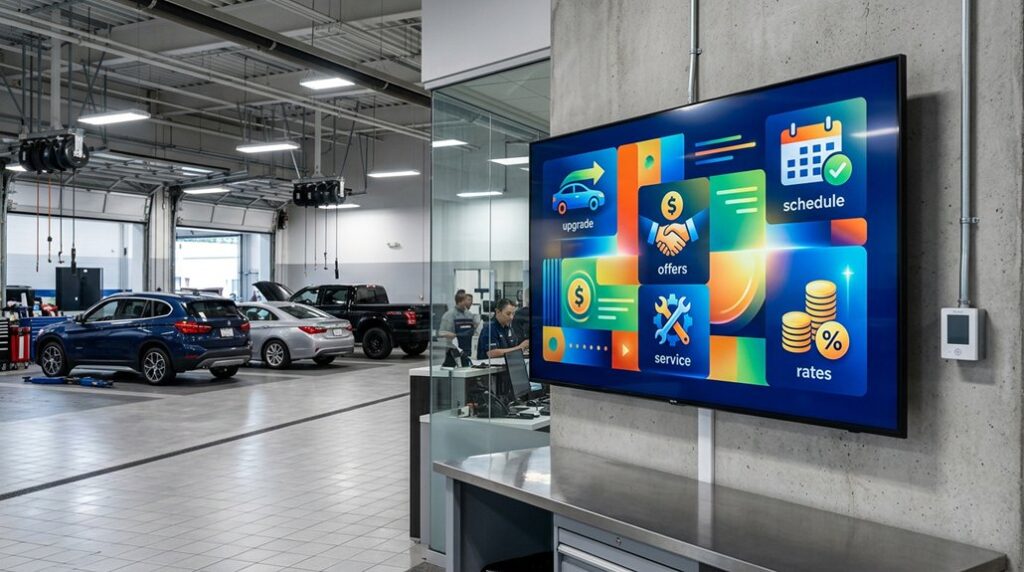
Because visibility drives accountability, integrating Fixed Ops leaderboards with mobile devices and TV screens turns performance data into actionable momentum across your shop floor. You’ll get real-time metrics—ROs, efficiency, sales—updated every 15 minutes, so decisions are based on the latest numbers. mobile display benefits and TV integration advantages accelerate responsiveness, reduce lag in coaching, and improve operational efficiency through immediate KPI access.
- Real-time refresh: automatic 15-minute updates keep focus current.
- Multi-device access: smartphones, tablets, desktops broaden reach.
- Custom signage: tailored digital solutions fit space and budget for max ROI.
- Seamless setup: compatibility with modern TVs and DMS platforms enables quick deployment and immediate staff engagement.
This approach is strategic, measurable, and results-driven.
Create Friendly Competition and Clear Accountability
Moving from real-time displays to how those numbers shape behavior, DMS Fixed Ops Leaderboards turn visibility into measurable motivation by creating friendly competition and clear accountability. You’ll see service advisors and technicians tracked every 15 minutes on Customer Pay RO Count, AROV, ELR and CSI, which sharpens team dynamics by making contributions transparent. That visibility fuels targeted coaching: managers spot underperformance quickly and deliver specific feedback rather than guesswork. Live rankings on mobile and TV create low-friction performance incentives that reward consistency and spotlight top performers, driving peer-led improvement. Because reports are timely and actionable, you can align daily goals with measurable outcomes, enforce accountability without micromanaging, and sustain momentum through frequent, data-driven recognition.
Measure ROI: Turn Leaderboard Activity Into Profit and Retention
ROI is best understood as a chain reaction: leaderboard visibility drives targeted behaviors (higher AROV, better ELR, improved CSI), those behaviors lift revenue per RO and retention rates, and the resulting margin gains and repeat customers quantify the leaderboard’s value. You’ll measure ROI by linking leaderboard signals to concrete financial and retention outcomes. Use these steps to convert activity into profit and loyalty:
Leaderboard visibility sparks targeted behaviors—higher AROV, stronger ELR, improved CSI—that drive revenue, margins, and repeat customers.
- Track lifts in Average Repair Order Value and Effective Labor Rate versus baseline.
- Correlate CSI and Customer Pay RO Count improvements with repeat-service frequency.
- Quantify margin impact from increased AROV and reduced missed opportunities.
- Tie employee engagement metrics to reduced churn and retention tactics effectiveness.
Those ROI strategies let you prioritize actions, justify investments, and scale practices that drive measurable profit.
Frequently Asked Questions
How Do Leaderboards Handle Data Privacy and Employee Consent?
They enforce data security, guarantee employee transparency, and embed consent management—so you comply with privacy regulations, limit visible metrics, anonymize identifiers, log access, and provide opt-in/out choices to balance motivation with legal and ethical protection.
Can Leaderboards Integrate With Non-Dms Workshop Tools?
Yes — you can integrate leaderboards with non-DMS workshop tools to boost workshop efficiency; you’ll need robust leaderboard integration, guarantee data accuracy, design for user engagement, and map workflows strategically to drive measurable operational results.
What Training Is Needed to Interpret Leaderboard Metrics?
You’ll need training workshops focused on metric analysis and data interpretation, linked to performance benchmarks, with hands-on skill development, regular feedback sessions, and strategic coaching so you can translate metrics into actions and drive measurable results.
How Do Leaderboards Account for Part-Time or Multi-Role Staff?
Like a mosaic, you segment shifts by role and hours: you’ll implement part time recognition and multi role tracking, weighting contributions proportionally, setting role-specific KPIs, and reporting adjusted scores to drive fair, measurable performance gains.
Are There Options for Multilingual Leaderboard Displays?
Yes — you can enable multilingual support in the user interface, letting you toggle languages, localize labels and metrics, and tailor translations. That strategic flexibility boosts adoption, clarity, and measurable engagement across diverse service teams.
Conclusion
You’ll treat DMS fixed ops leaderboards like a precision instrument—tuning KPIs, daily targets, and live displays to turn data into action. By spotting coaching moments, integrating mobile and TV, and fostering friendly competition, you’ll drive accountability and measurable gains. Use leaderboards to convert activity into profit and retention, then track ROI constantly. Stay strategic, iterate quickly, and watch steady, data-driven improvements compound into tangible service performance results.